Pivot Table Group Dates By Month
August 06, 2002 - by Bill Jelen
Steve, a client from the Carolinas, asked the question which lead to this tip. It is common for data imported from an external system to have a date field. There is a simple method with in a pivot table to have the date field converted to weeks, months, quarters or years.

Pivot tables are a truly amazing feature of Excel. If you are not familiar with how to create a pivot table, review Excel Pivot Table Advanced Tricks.
I use pivot tables fairly often, and just recently discovered the ability to automatically group dates into months or years for analysis in pivot tables.
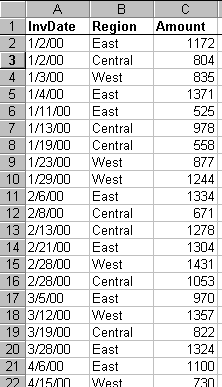
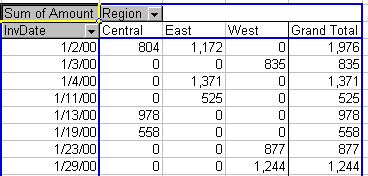
Using the normal pivot table wizard, it is fairly straight forward to take data like that shown at the left and to create the pivot table shown below. This basic pivot tables has dates going down the side, regions going across the top.

Back in the days of Excel 95, if you wanted to replace the daily dates with months, you had to resort to inserting a new column in your source data with the day() function. In today's version of Excel, there is an easier way.

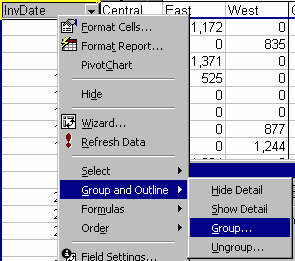
To start, right click on the date field in your pivot table. From the pop-up menu, pick Group and Outline, then pick Group...
Note that this option is only available for fields in the row or column section of the pivot table. If you want to group a field in the Page section of a pivot table, you must first drag it down to columns, group it, then drag it back up to the Page section.

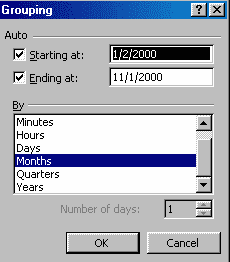
Excel offers 7 default grouping levels. You can select one or more of these from the Grouping dialog box. If you select a single grouping level, the pivot table field (in this case, InvDate) will remain as a field but will now show up grouped to the particular level.
If you happen to select several grouping levels (say, Month, Quarter, Year), then Excel will add a new field to the pivot field list for the 2nd and 3rd groups. By default, Excel assigns a name like "Quarters" or "Years" to these later pivot tables. Thus, this tip is a great solution to the question: "Why does my pivot table have extra fields called "Years" which do not appear to be in my source data?"
Excel's default naming convention for the 2nd and 3rd grouping level leaves a lot to be desired when you have 2 date fields in your pivot table and you group them both up to months, quarters and years. Let's say you have a field for due date and another field for actual completion date. If you group both of these fields up to months, quarters, and years, the pivot field list will offer quarters and years twice, and you will have to recall in which order you added the fields when later dragging them from the pivot field list onto the pivot table. For this reason, I suggest using the field information dialog to rename the field from years to something more meaningful.

After specifying that you want InvDate grouped by month, the pivot table recalculates and collapses the dates down to one per month. This is a very efficient method for providing summary level views of data with a date component.
