Excel Chart - stacked column to chart progress

kschreib

New Member
Joined
Aug 20, 2007
Messages
3
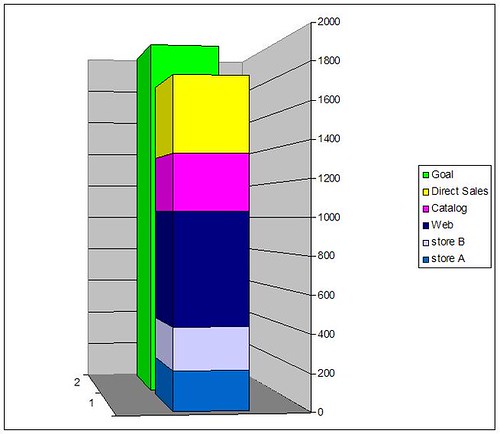
I have been asked to create a chart that will chart progress for product sales against a specific target and we would like to know which sales channels the sales are coming from. This is mostly supposed to be an easy visual aid for a quick view of the progress. I am thinking that the thermometer type charts would be a good starting point, but I don't know if it's possible to use a stacked column in place of the typical column in the thermometer charts to show overall progress, but also the makeup of the sales by sales channels. This is a relatively short term project and I'd like to be able to use just one bar and update it every few weeks. Any suggestions? Thanks!
 

Excel Facts

Which lookup functions find a value equal or greater than the lookup value?
MATCH uses -1 to find larger value (lookup table must be sorted ZA). XLOOKUP uses 1 to find values greater and does not need to be sorted.
So you want each segment in the stacked bar to represent a different sales channel, with the overall height of the combined stack representing progress toward the goal? No problem.

Sales channel...amount
Store X............62345..............0
Store Y............71324..............0
Web................83212..............0
Catalog...........10001...............0
Goal......................0.........150000

Select the three columns and hit the graph tool. Select the stacked bar graph type. Select Series in Rows, not columns. This give you one column on the left, with each sales channel in a different color, stacked on one another, and a second column on the right, just the one color, representing the goal.

Look about like what you want? There are other ways to do it, if not.
 
Upvote 0
Thank you for that. That is pretty much what I am looking for, but I am wondering if it's possible to overlay the stacked column over the goal column for a clearer or more understandable visual representation?
 
Upvote 0
You could make another entry in the first column which is amount remaining until goal, and make it an obvious different color maybe. I'll look into overlay, but off the top of my head I've got nothing.
 
Upvote 0
I've got it. Use chart type Column, chart sub-type Stacked column with 3-D visual effect. Then you can turn and pivot the 3-D graph so the Goal column is "behind" the actuals stack.
 
Upvote 0
Looks like this:
1195258657_14c703835d.jpg
 
Upvote 0
I always tell people to avoid 3D effects, and they wonder why. You've helped demonstrate for me. For example, I cannot do better than guess the values of any of the bars, except perhaps the top of the dark blue one. I cannot tell where to extrapolate the lines otherwise. DOes the yellow one stop midway between 1800 and 2000? No it's probably closer to 1800, or maybe lower, but I don't know where to draw the lines. The pink bar doesn't stop at 1400, either, probably a bit lower. Impossible to tell.

You could use side by side 2D columns and remove this uncertainty. Or add a series with the total, and convert it to a line chart type. I've posted a short description of these approaches here:

http://peltiertech.com/Excel/Commentary/2Dor3DColumn.html
 
Upvote 0
Hey! Waddaya mean "the colors could use a little work" (see Jon's link above)? :biggrin:

I do like the final result with the "Goal" as an XY series. Much cleaner than the 3-D columns. I was going in that direction with my first reply, but kschreib seemed to want to pursue the column-behind-column approach, so that's where I went. I think when he sees your result, he may decide that he too likes it better.
 
Upvote 0

Forum statistics

Threads
1,212,927
Messages
6,110,710
Members
448,293
Latest member
jin kazuya

We've detected that you are using an adblocker.

We have a great community of people providing Excel help here, but the hosting costs are enormous. You can help keep this site running by allowing ads on MrExcel.com.
Allow Ads at MrExcel

Which adblocker are you using?

Disable AdBlock

Follow these easy steps to disable AdBlock

1)Click on the icon in the browser’s toolbar.
2)Click on the icon in the browser’s toolbar.
2)Click on the "Pause on this site" option.
Go back

Disable AdBlock Plus

Follow these easy steps to disable AdBlock Plus

1)Click on the icon in the browser’s toolbar.
2)Click on the toggle to disable it for "mrexcel.com".
Go back

Disable uBlock Origin

Follow these easy steps to disable uBlock Origin

1)Click on the icon in the browser’s toolbar.
2)Click on the "Power" button.
3)Click on the "Refresh" button.
Go back

Disable uBlock

Follow these easy steps to disable uBlock

1)Click on the icon in the browser’s toolbar.
2)Click on the "Power" button.
3)Click on the "Refresh" button.
Go back
Back
Top