Ok, so here's the trick:
I know how to create combo or mixed graphs with line/bars on single axis, and secondary axis. I even know how to do mixed stacked and unstacked columnar charts...
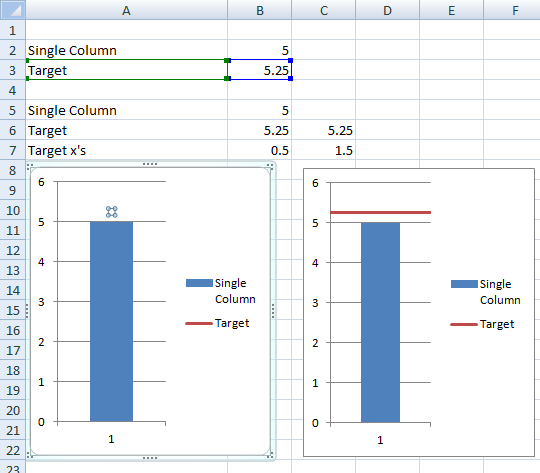
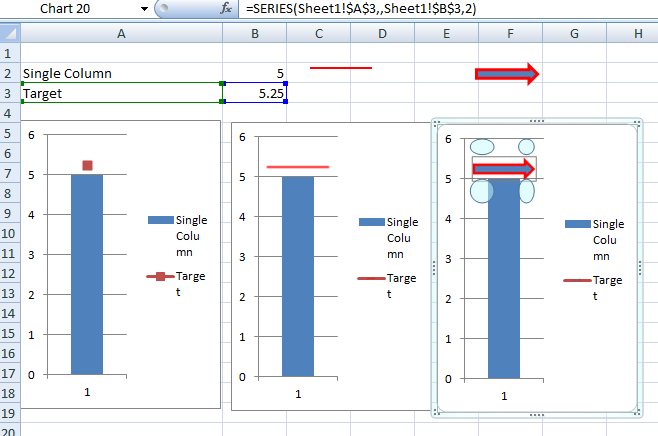
But how do you depict in single view graph
a single bar (1 datapoint) with a single line (upper control limit e.g. target).?
And I don't want to to use shapes to draw the target line.
I want the target line to be automatically plotted by Excel...
Anyone?
Thanks!
I know how to create combo or mixed graphs with line/bars on single axis, and secondary axis. I even know how to do mixed stacked and unstacked columnar charts...
But how do you depict in single view graph
a single bar (1 datapoint) with a single line (upper control limit e.g. target).?
And I don't want to to use shapes to draw the target line.
I want the target line to be automatically plotted by Excel...
Anyone?
Thanks!