
Learn Excel 2013 GAUSS Function
September 07, 2012 - by Bill Jelen
Excel 2013 includes 52 new functions, most of which were added to be compliant with the Open Document Spreadsheet standards.
This post will cover the Excel 2013 Gauss function.
Currently, Excel help is a bit lackluster in their description of the function.
Syntax: =GAUSS(x) - Returns 0.5 less than than the standard normal cumulative distribution.
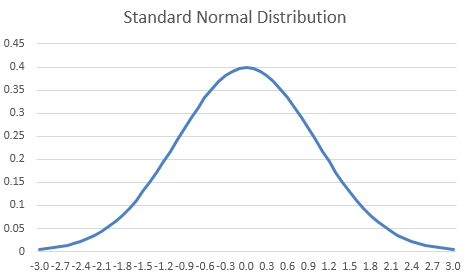
As a quick refresher, the standard normal distribution is a special case with a mean of 0 and a standard deviation of 1. You will recognize it as the bell curve.
Excel has always had a way of calculating probabilities for the standard normal curve. First NORMSDIST and then in Excel 2010 NORM.S.DIST(z,True) would calculate probabilities. The "z" argument is the number of standard deviations from the mean.
Here is a trivial example of using NORM.S.DIST to calculate a probability. What is the probability that a random member from the population is going to be smaller than -0.5 standard deviations from the mean? This is the area shaded in Figure 2. The formula is simply =NORM.S.DIST(-0.5,True).
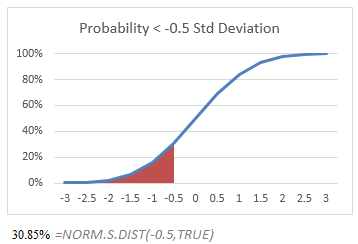
Simple enough, right? If you were only interested in small things, this formula would be all you need. However, researchers are frequently interested in other ranges than the left side of the curve.
In Figure 3, you want to know the probability of a random member falling between (mean-0.5 standard deviations) and (mean+1 standard deviations). There isn’t a NORM.S.DIST.RANGE function, so you can simply ask for the probability between -0.5,1). Instead, you have to find the answer in two subformulas. Calculate the probability of being smaller than +1 with =NORM.S.DIST(1,True) and then subtract the probability of being smaller than -0.5 with =NORM.S.DIST(-.5,True). You can do this in a single formula as shown in Figure 3.
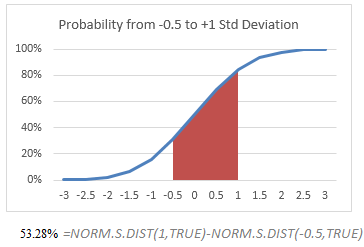
I realize this is a long post, but the image above is the most important image for understanding the new GAUSS function. Re-read that paragraph to make sure you understand the concept. To get the probability that a member of the population will fall between two points on the curve, you start with the NORM.S.DIST of the right point and subtract the NORM.S.DIST of the left point. Its not rocket science. It isn’t even as complicated as VLOOKUP. The function always returns the probability from the left edge of the curve (-infinity) to the value of z.
What if you are interested in the probability of being larger than a certain size? To find the chance of being larger than (mean+1 standard deviation), you can start with 100% and subtract the possibility of being smaller than (mean+1 standard deviation). This would be =100%-NORM.S.DIST(1,True). Since 100% is the same as 1, you could shorten the formula to =1-NORM.S.DIST(1,True). Or, you can realize that the curve is symmetric and ask for the NORM.S.DIST(-1,True) to get the same answer.
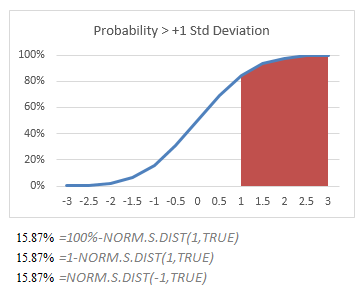
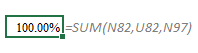
For those of you as OCD as I am, I can assure you that if you =SUM(30.85,53.28,15.87) you end up with 100%. I know because I checked it in the worksheet.
Going back to Figure 3 – you should know how to calculate the probability from any two points z1 and z2. Subtract NORM.S.DIST(z2,True)-NORM.S.DIST(z1,True) and you will have the answer. Let’s consider the very special case where z1 is the mean. You are trying to figure out the probability of someone being between the mean and +1.5 standard deviations from the mean, as illustrated in Figure 6.
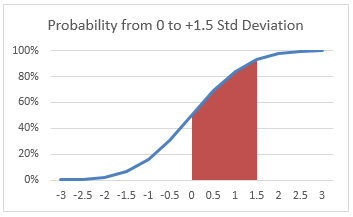
Using what you learned from Figure 3, which of these would find the probability of the area under the curve above?
-
=NORM.S.DIST(1.5,True)-NORM.S.DIST(0,True) -
=NORM.S.DIST(1.5,True)-NORM.S.DIST(0,True) -
=NORM.S.DIST(1.5,True)-NORM.S.DIST(0,True) - None of the Above
How did you do? Provided you answered A, B, or C you scored 100% on the test. Congratulations. As I said, it really isn’t rocket science.
For those of you who love shortcuts, remember that there is a 50% probability that something will be less than or equal to the mean. When you see =NORM.S.DIST(0,True), you can instantly think, "Oh – that is 50%!". So, answer B above could be rewritten as
=NORM.S.DIST(1.5,True)-50%
But if you love shortcuts, you hate typing 50% and would shorten it to .5:
=NORM.S.DIST(1.5,True)-.5
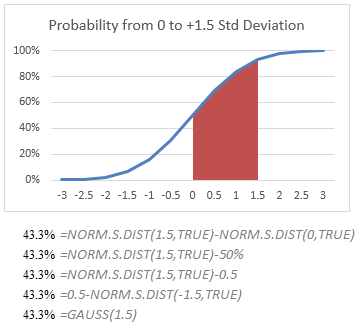
Could you use the symmetrical opposite of the area under the curve? Yes, =.5-NORM.S.DIST(-1.5,True) will give you the same result. So, the quiz above could be:
-
=NORM.S.DIST(1.5,True)-NORM.S.DIST(0,True) -
=NORM.S.DIST(1.5,True)-.5 -
=.5-NORM.S.DIST(-1.5,True) - All of of the Above
Provided you choose an answer, I will give you full credit. After all, it is Excel. There are five ways to do anything and I will accept any answer that works (well, other than hard-coding =0.433 in a cell).
For those of you who got the answer for the last question correct, stop reading. Everyone else will need GAUSS:
What about the GAUSS function? Well, the GAUSS function gives us yet another way to solve the specific case where the range goes from the mean to a point above the mean. Rather than using the answers above, you could use =GAUSS(1.5).
Yes... they added a function for people who can not subtract 0.5 from NORM.S.DIST!
If you are like me, you are asking, "Seriously? They wasted resources on adding this function?" Well, back in Excel 2007, the Excel team made a decision to allow us to save documents in the .ODS format. This is the Open Document Spreadsheet format. It is not a format controlled by Microsoft. Since they are offering support for ODS, Microsoft is forced to add all functions that the Open Document Spreadsheet supports. Apparently, a majority of people on the Open Document Spreadsheet consortium could not figure out that the answer to my first quiz was A, so they added a whole new function.
I am guessing Microsoft wasn’t thrilled about adding support for functions that were similar to other functions already in Excel. I can almost imagine the conversation between the tech writer tasked with writing about GAUSS in Excel Help and the project manager on the Excel team:
Writer: "So, tell me about GAUSS"
PM: "It’s inane. Take =NORM.S.DIST and subtract 0.5. I can’t believe we had to add this."
The writer then edited out the editorial comments and offered up this Help topic:
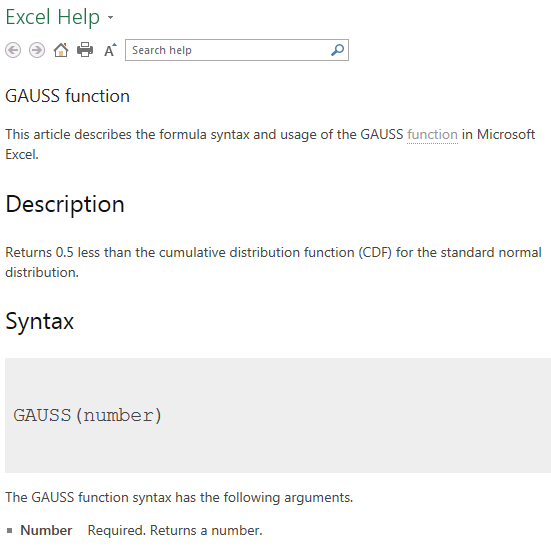
So – let me offer this alternate help topic:
GAUSS(z) – Calculates the probability that a member of a standard normal population will fall between the mean and +z standard deviations from the mean.
- z Required. The number of standard deviations above the mean. Generally in the range of +0.01 to +3.
- Added to Excel 2013 to support people who can not subtract two numbers.
-
Not particularly meaningful for negative values of Z. To calculate the probability that something falls in the range of -1.5 to the mean, use
=GAUSS(1.5). -
Will not work in Excel 2010 and earlier. In Excel 2010 and earlier, use
=NORM.S.DIST(z,True)-0.5.
There you have it... more than you ever wanted to know about GAUSS. It is certainly more than I ever wanted to know. By the way, my Excel In Depth books offer a complete description of all of the 452 functions in Excel. Check out the previous edition, Excel 2010 In Depth or the new Excel 2013 In Depth to be released in November 2012.