
Analyze Lottery Numbers in Excel
May 09, 2005
Excel has a number of great tools for playing the lottery. You can use Excel to generate random numbers, to analyze past numbers to see if any numbers are "hot". You can also use Excel's functions to determine the odds of winning.
Note
The tips in today's show require the Analysis Toolpack to be installed. From the menu, select Tools - Addins, and then check the box for Analysis Toolpack.
Excel has some great tools for analyzing lottery numbers. If you believe that certain numbers can be "hot", then Excel has two tools that will let you see which numbers are coming up more often than others.
I downloaded data from the Ontario lottery site showing winning numbers for the past 3 months.
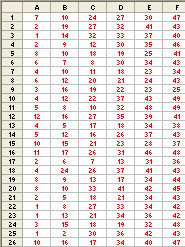
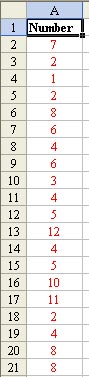
Using cut and paste, copy the numbers into a single column of data. Add a heading in cell A1.
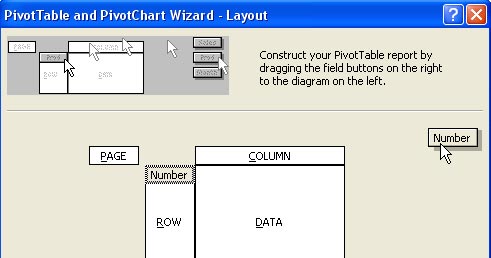
Select one cell in the data. From the menu, select Data - PivotTable. Click Next in Step 1 and Step 2. In step 3, choose the Layout button in the lower left corner. Drag the Number button from the right side of the Layout dialog and drop it in the Row area.
Drag the Number button to the Data area and it will appear as "Sum of Number". Instead of summing, you want to find a count of how many times each number has appeared. In the Layout dialog, double-click the Sum of Number button to display the PIvotTable Field dialog. In that dialog, choose to Summarize by Count.
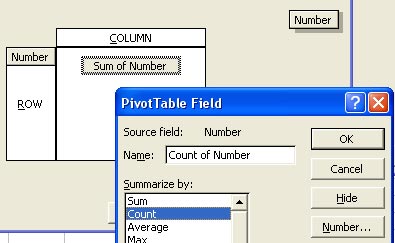
Click OK to close the Field dialog.
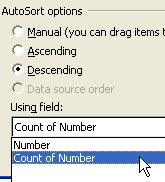
You would like to have the report presented with the most popular numbers at the top. Double click the Number field in the Row area of the Layout dialog. This will present a different version of the PivotTable Field dialog. Choose the Advanced button.

In the Advanced Options dialog, choose to sort Descending by Count of Number.
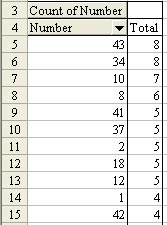
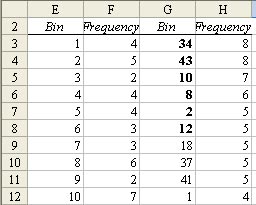
Click OK three times to return to the Pivot Table Wizard step 3. Click Finish. The resulting pivot table shows that the numbers 43 and 34 have come up far more than the average number. If you believe that numbers can be hot, you might want to play 43, 34, 10, 8, 41, and 37.
Excel offers many ways to achieve any result. On the show, I also showed how to use Tools - Data Analysis - Histogram.
In column C, set up a Bin range. This is simply the numbers from 1 to 49.
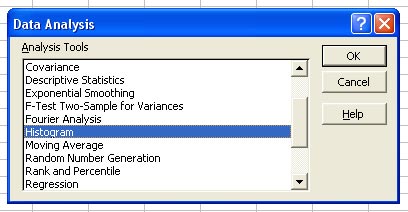
From the menu, select Tools - Data Analysis - Histogram. Fill out the dialog as shown here.
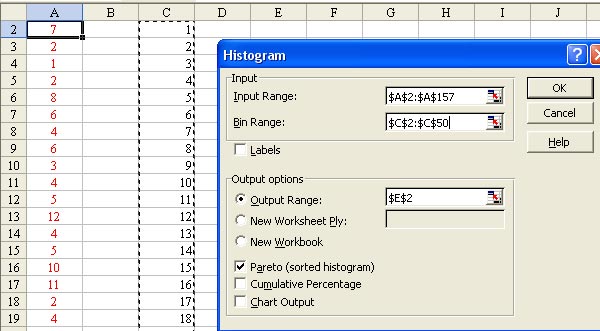
In the results, the first two columns show how often each number has been selected. Columns G & H offer a sorted version with the most popular numbers at the top. The histogram suggests that you might want to play 43, 34, 10, 8, 2, and 12.
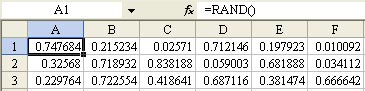
Scientists will argue that the lottery balls have no memory. If the machine is truly random, the fact that a number has come up recently does not mean that it will come up again. If you believe this, then you should select truly random numbers. Excel has a =RAND() function to help with this. If you enter =RAND() in a number of cells, you will have a variety of numbers in the range of 0 to 0.9999999.
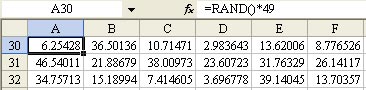
If you use =RAND()*49, Excel will return numbers from 0 to 48.999999.
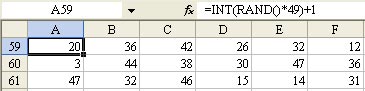
If you use =INT(RAND()*49)+1, Excel will return numbers from 1 to 49.
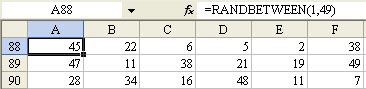
With the Analysis Toolpack installed, you can use the simpler =RANDBETWEEN(1,49) to obtain integers between 1 and 49.
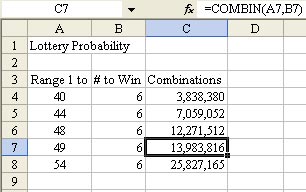
Finally, is it even a good deal to play the lottery? Use the =COMBIN() function to find out. The Ontario lottery requires you to select 6 numbers out of a pool of 49 numbers. The formula in C7 is =COMBIN(49,6) and shows that there are 13,983,816 possible results. Thus, if the lotto jackpot is greater than 14 million as a cash option, then your payout would exceed the odds.