Actual 3D Graphs in Excel (for Mac)

Mattantaliss

Board Regular
Joined
Sep 6, 2005
Messages
52
I have three columns of values that I want to graph on an actual 3D (x-, y-, z-axis) chart. As far as I can find, Excel only offers 3D charts as a visual effect. Is there a way to graph 3D data, or does Excel really only have the capability to do 2D?

For system info, I'm running Excel:mac 2008 (ver 12.2.3) on Mac OS X (ver 10.6.2).
 

Excel Facts

Best way to learn Power Query?
Read M is for (Data) Monkey book by Ken Puls and Miguel Escobar. It is the complete guide to Power Query.
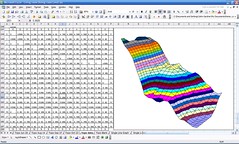
Try the surface chart. The data for a surface chart must be laid out in a matrix of cells, with the Z values in the matrix. If you have a few points to graph and most of the X Y intersections have no data, this is not the chart for you.

Here's a miniature sample:
4234134447_b203f6c33a_m.jpg
 
Upvote 0

Forum statistics

Threads
1,224,558
Messages
6,179,512
Members
452,921
Latest member
BBQKING

We've detected that you are using an adblocker.

We have a great community of people providing Excel help here, but the hosting costs are enormous. You can help keep this site running by allowing ads on MrExcel.com.
Allow Ads at MrExcel

Which adblocker are you using?

Disable AdBlock

Follow these easy steps to disable AdBlock

1)Click on the icon in the browser’s toolbar.
2)Click on the icon in the browser’s toolbar.
2)Click on the "Pause on this site" option.
Go back

Disable AdBlock Plus

Follow these easy steps to disable AdBlock Plus

1)Click on the icon in the browser’s toolbar.
2)Click on the toggle to disable it for "mrexcel.com".
Go back

Disable uBlock Origin

Follow these easy steps to disable uBlock Origin

1)Click on the icon in the browser’s toolbar.
2)Click on the "Power" button.
3)Click on the "Refresh" button.
Go back

Disable uBlock

Follow these easy steps to disable uBlock

1)Click on the icon in the browser’s toolbar.
2)Click on the "Power" button.
3)Click on the "Refresh" button.
Go back
Back
Top