Hi
I am new at working with VBA and Macros and would like to ask for some guidance on where to find a solution for the below procedure:
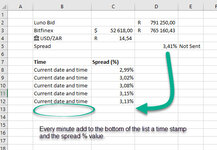
I have a sheet that is populated with live data I am fetching from Cryptocurrency exchanges (live meaning refreshing the data every 10 seconds). I perform some calculations to determine a % price/spread difference in a cell ("D5" in my case) What I would like to achieve is to start collecting this cell value ("D5") every minute and to start populating a list with these values so that over time I can use these data points to plot a graph of the percentage price difference between the two assets. The list can have a finite row length of say 240000 data points or less. Once the range limit has been reached the oldest data can be discarded.
Is it possible to have a graph updating automatically as the list values are added? I have added a screenshot of what I thought it could look like.
Any assistance would be greatly appreciated.
Thank you,
I am new at working with VBA and Macros and would like to ask for some guidance on where to find a solution for the below procedure:
I have a sheet that is populated with live data I am fetching from Cryptocurrency exchanges (live meaning refreshing the data every 10 seconds). I perform some calculations to determine a % price/spread difference in a cell ("D5" in my case) What I would like to achieve is to start collecting this cell value ("D5") every minute and to start populating a list with these values so that over time I can use these data points to plot a graph of the percentage price difference between the two assets. The list can have a finite row length of say 240000 data points or less. Once the range limit has been reached the oldest data can be discarded.
Is it possible to have a graph updating automatically as the list values are added? I have added a screenshot of what I thought it could look like.
Any assistance would be greatly appreciated.
Thank you,