Additional Range (series) with each data points in graph

mandukes

Forum Rules
Joined
May 25, 2013
Messages
90
Is it possible to add additional range value in the same graph points?


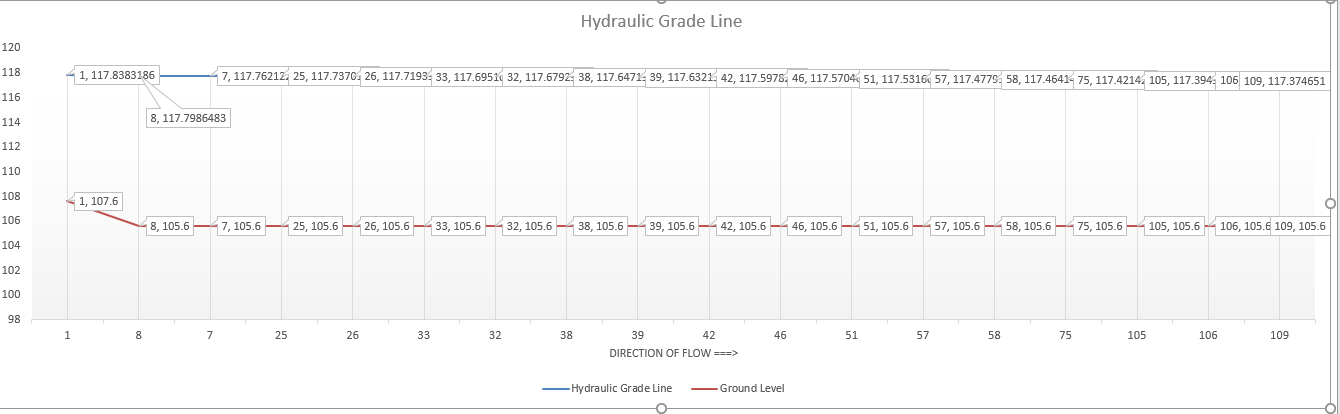
For example in the second plot (1, 107.6) (8, 107.6) (7,105.6).. so on


instead of the first figures 1,8,7, I need to plot data from a different range: 300, 250,250... so on


So the result should be (300, 107.6) (250, 107.6) (250,105.6).. so on

Please see the screenshot below.


Regards,
~M


f1d6b584b1c5ca7385fafe12f3432325.png
 
Last edited:

Excel Facts

Format cells as currency
Select range and press Ctrl+Shift+4 to format cells as currency. (Shift 4 is the $ sign).

Forum statistics

Threads
1,214,653
Messages
6,120,751
Members
448,989
Latest member
mariah3

We've detected that you are using an adblocker.

We have a great community of people providing Excel help here, but the hosting costs are enormous. You can help keep this site running by allowing ads on MrExcel.com.
Allow Ads at MrExcel

Which adblocker are you using?

Disable AdBlock

Follow these easy steps to disable AdBlock

1)Click on the icon in the browser’s toolbar.
2)Click on the icon in the browser’s toolbar.
2)Click on the "Pause on this site" option.
Go back

Disable AdBlock Plus

Follow these easy steps to disable AdBlock Plus

1)Click on the icon in the browser’s toolbar.
2)Click on the toggle to disable it for "mrexcel.com".
Go back

Disable uBlock Origin

Follow these easy steps to disable uBlock Origin

1)Click on the icon in the browser’s toolbar.
2)Click on the "Power" button.
3)Click on the "Refresh" button.
Go back

Disable uBlock

Follow these easy steps to disable uBlock

1)Click on the icon in the browser’s toolbar.
2)Click on the "Power" button.
3)Click on the "Refresh" button.
Go back
Back
Top