Advanced stacked bar chart

TimvMechelen

Board Regular
Joined
Nov 7, 2016
Messages
121
Dear all,

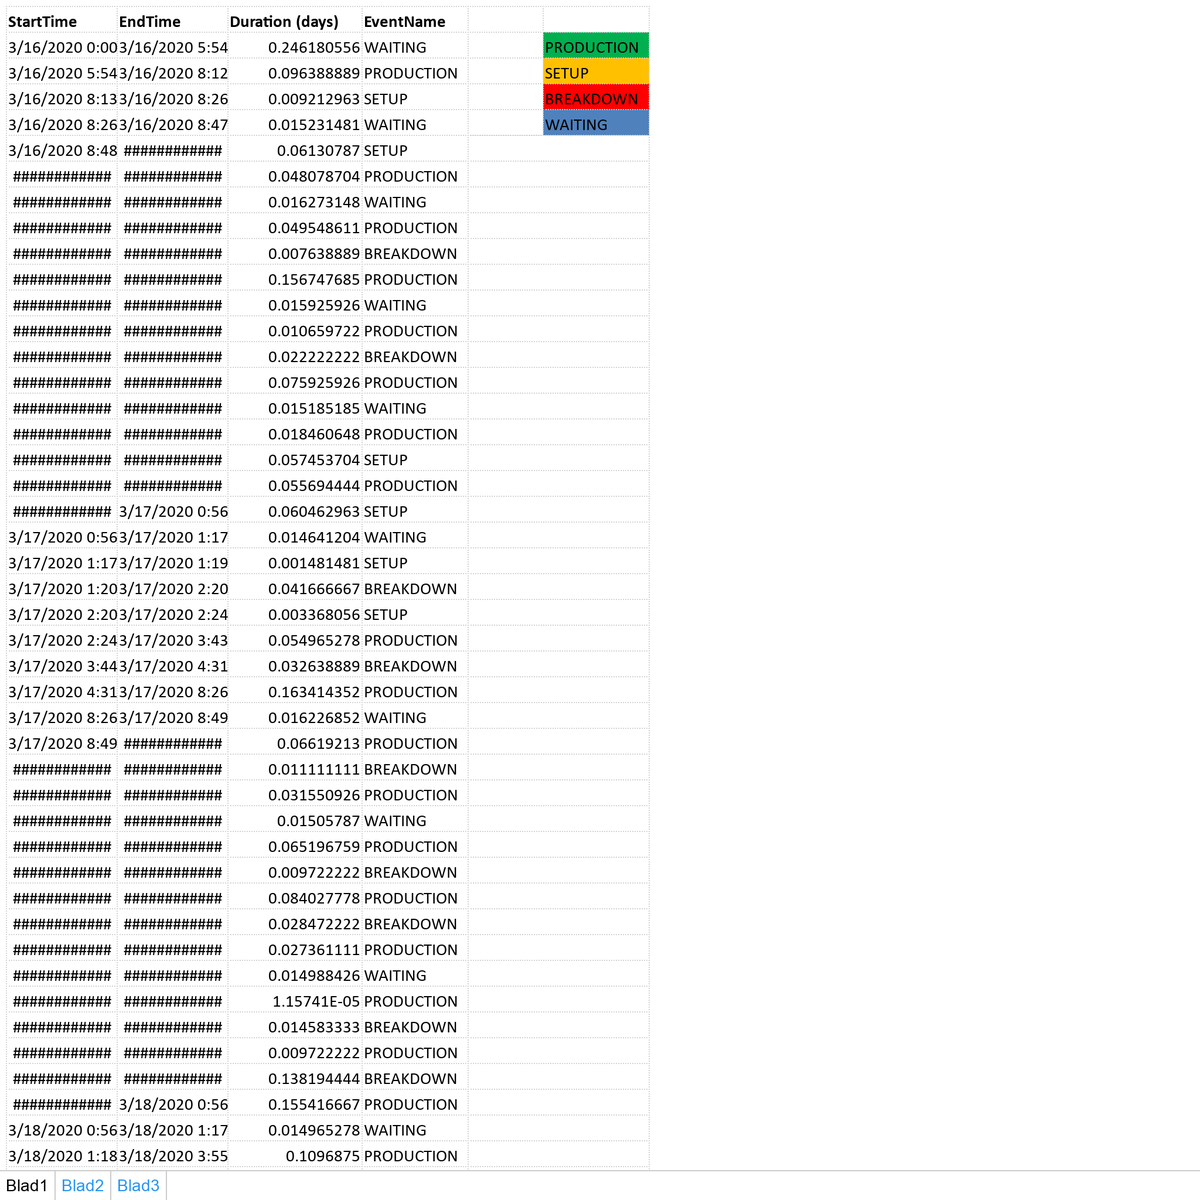
I'd like a stacked bar chart that is displaying each category in a given color. The colors are given in the file attached.
As an example I have added the image below. I would like to have one stacked bar chart (not one above the arrow and one below) with a timeline at the bottom. Is this possible?

Be aware that there are moments in time where there is no category, these parts has to stay open.

Data file:

time-value-map-8-638.jpg


Thank you!
 

Excel Facts

How to total the visible cells?
From the first blank cell below a filtered data set, press Alt+=. Instead of SUM, you will get SUBTOTAL(9,)
A preliminary version:

VBA Code:
Sub Tim()
Dim LR%, rng As Range, i%, c
LR = Range("a" & Rows.Count).End(xlUp).Row
Set rng = Range(Cells(LR + 2, 2), Cells(LR + 17, 12))
ActiveSheet.Shapes.AddChart2(201, xlColumnClustered).Select
With ActiveChart
    .SetSourceData Source:=Range("Blad1!$B$1:$C$" & LR)
    .PlotBy = xlRows
    .Parent.Height = rng.Height
    .Parent.Width = rng.Width
    .Parent.Top = rng.Top
    .Parent.Left = rng.Left
    .HasTitle = False
End With
For i = 2 To LR
    Select Case Cells(i, 4)
        Case "SETUP"
        c = RGB(245, 180, 90)
        Case "WAITING"
        c = RGB(100, 135, 230)
        Case "PRODUCTION"
        c = RGB(5, 230, 10)
        Case "BREAKDOWN"
        c = RGB(245, 15, 10)
    End Select
    With ActiveChart.FullSeriesCollection(i - 1).Format.Fill
        .Visible = msoTrue
        .ForeColor.RGB = c
        .Transparency = 0.1
        .Solid
    End With
    If i Mod 10 = 0 Then
        ActiveChart.FullSeriesCollection(i - 1).ApplyDataLabels
        With ActiveChart.FullSeriesCollection(i - 1).DataLabels
            .ShowValue = 0
            .ShowSeriesName = 1
            .Orientation = xlUpward
            .Format.TextFrame2.Orientation = msoTextOrientationUpward
        End With
    End If
Next
End Sub
 
Upvote 0
Maybe you have an older Excel version, try this instead:


VBA Code:
With ActiveChart.SeriesCollection
 
Upvote 0
Now I get the error at ActiveSheet.Shapes.AddChart2(201, xlColumnClustered).Select with the code below.

VBA Code:
Sub Tim()
Dim LR%, rng As Range, i%, c
LR = Range("a" & Rows.Count).End(xlUp).Row
Set rng = Range(Cells(LR + 2, 2), Cells(LR + 17, 12))
ActiveSheet.Shapes.AddChart2(201, xlColumnClustered).Select
With ActiveChart
    .SetSourceData Source:=Range("Blad1!$B$1:$C$" & LR)
    .PlotBy = xlRows
    .Parent.Height = rng.Height
    .Parent.Width = rng.Width
    .Parent.Top = rng.Top
    .Parent.Left = rng.Left
    .HasTitle = False
End With
For i = 2 To LR
    Select Case Cells(i, 4)
        Case "SETUP"
        c = RGB(245, 180, 90)
        Case "WAITING"
        c = RGB(100, 135, 230)
        Case "PRODUCTION"
        c = RGB(5, 230, 10)
        Case "BREAKDOWN"
        c = RGB(245, 15, 10)
    End Select
    With ActiveChart.SeriesCollection(i - 1).Format.Fill
        .Visible = msoTrue
        .ForeColor.RGB = c
        .Transparency = 0.1
        .Solid
    End With
    If i Mod 10 = 0 Then
        ActiveChart.SeriesCollection(i - 1).ApplyDataLabels
        With ActiveChart.SeriesCollection(i - 1).DataLabels
            .ShowValue = 0
            .ShowSeriesName = 1
            .Orientation = xlUpward
            .Format.TextFrame2.Orientation = msoTextOrientationUpward
        End With
    End If
Next
End Sub
 
Upvote 0
New version:

VBA Code:
Sub Tim()
Dim LR%, i%, c, co As ChartObject
LR = Range("a" & Rows.Count).End(xlUp).Row
Set co = ActiveSheet.ChartObjects.Add(Left:=[b2].Left, Width:=Range("b1:n1").Width, _
Top:=Cells(LR + 2, 2).Top, Height:=Range("a1:a15").Height)
co.Chart.ChartType = xlColumnClustered
With co.Chart
    .HasLegend = False
    .SetSourceData Source:=Range("Blad1!$B$1:$C$" & LR)
    .PlotBy = xlRows
    .HasTitle = False
End With
For i = 2 To LR
    Select Case Cells(i, 4)
        Case "SETUP"
        c = RGB(245, 180, 90)
        Case "WAITING"
        c = RGB(100, 135, 230)
        Case "PRODUCTION"
        c = RGB(5, 230, 10)
        Case "BREAKDOWN"
        c = RGB(245, 15, 10)
    End Select
    With co.Chart.SeriesCollection(i - 1).Format.Fill
        .Visible = msoTrue
        .ForeColor.RGB = c
        .Transparency = 0.1
        .Solid
    End With
    If i Mod 10 = 0 Then
        co.Chart.SeriesCollection(i - 1).ApplyDataLabels
        With co.Chart.SeriesCollection(i - 1).DataLabels
            .ShowValue = 0
            .ShowSeriesName = 1
            .Orientation = xlUpward
            .Format.TextFrame2.Orientation = msoTextOrientationUpward
        End With
    End If
Next
End Sub
 
Upvote 0

Forum statistics

Threads
1,214,832
Messages
6,121,853
Members
449,051
Latest member
excelquestion515

We've detected that you are using an adblocker.

We have a great community of people providing Excel help here, but the hosting costs are enormous. You can help keep this site running by allowing ads on MrExcel.com.
Allow Ads at MrExcel

Which adblocker are you using?

Disable AdBlock

Follow these easy steps to disable AdBlock

1)Click on the icon in the browser’s toolbar.
2)Click on the icon in the browser’s toolbar.
2)Click on the "Pause on this site" option.
Go back

Disable AdBlock Plus

Follow these easy steps to disable AdBlock Plus

1)Click on the icon in the browser’s toolbar.
2)Click on the toggle to disable it for "mrexcel.com".
Go back

Disable uBlock Origin

Follow these easy steps to disable uBlock Origin

1)Click on the icon in the browser’s toolbar.
2)Click on the "Power" button.
3)Click on the "Refresh" button.
Go back

Disable uBlock

Follow these easy steps to disable uBlock

1)Click on the icon in the browser’s toolbar.
2)Click on the "Power" button.
3)Click on the "Refresh" button.
Go back
Back
Top