(cross post for: https://community.powerbi.com/t5/De...-0-in-table-and-charts-cumulative/td-p/324639)
Dear all,
I have a 'sales' table and a 'dates' table.
The dates table contains :
- Date (from jan2016 until dec 2020)
- month-day
- month-workday
- month
- year
...etc
For simplicity, the sales table contains:
- date
- business unit
- order number
- net sales amount
Note that there can be many orders per day and these can be all in the same or another business unit.
I have a filter on month and a filter on Business unit.
I made a double direction relation from sales[date] >> datetable[date]. I think this is correct, because i want to be able to show e.g number of orders for a certain month or business unit only and therefore i need the bidirectional filter.
Now i have a table that shows me, when i select a certain business unit and month, the sales per month day.
However, some small business unit could sell only every 5 days. So you would get in the table something like:
Day 1: 500
Day 6: 850
Day 11: 1350
...
etc
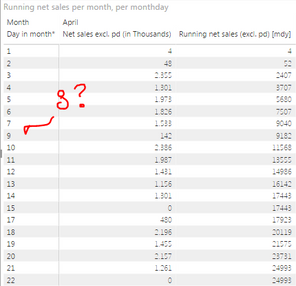
However, i would like to see also that the other days are 0. See the example table below, that has no value for month day 8.
(Note that it does show 2x value = 0 , but this is due to rounding as they are in fact not 0)
 /
/
Next to this, i have a question on the running total.
The running total works like a charm. But i have three things i dont like.
I have been messing around with all this REALLY long now
 and i get frustrated.
Do i miss a certain concept? (very likely)
Hope my questions are clear.
Best regards
DP
Dear all,
I have a 'sales' table and a 'dates' table.
The dates table contains :
- Date (from jan2016 until dec 2020)
- month-day
- month-workday
- month
- year
...etc
For simplicity, the sales table contains:
- date
- business unit
- order number
- net sales amount
Note that there can be many orders per day and these can be all in the same or another business unit.
I have a filter on month and a filter on Business unit.
I made a double direction relation from sales[date] >> datetable[date]. I think this is correct, because i want to be able to show e.g number of orders for a certain month or business unit only and therefore i need the bidirectional filter.
Now i have a table that shows me, when i select a certain business unit and month, the sales per month day.
However, some small business unit could sell only every 5 days. So you would get in the table something like:
Day 1: 500
Day 6: 850
Day 11: 1350
...
etc
However, i would like to see also that the other days are 0. See the example table below, that has no value for month day 8.
(Note that it does show 2x value = 0 , but this is due to rounding as they are in fact not 0)
Next to this, i have a question on the running total.
Code:
[/FONT][/COLOR][COLOR=#333333][RunningSales]] = CALCULATE(DIVIDE(sum(Sales[Sales)]);1000);FILTER(ALLSELECTED(sales[Day in month]);sales[Day in month]<=max(sales[Day in month])))[/COLOR][COLOR=#333333][FONT='inherit']- It also does not have values for day 8. I want it to show a value for 8 equal to value for 7
- I dont use the date table for this at all. I made a calculated column sales[day in month] and used that one, not something from the date table which i am under the impression is the best approach. How would i do this, while still allowing the filters to work?
- If i do get a table that always fills out values for all days in the month, and i would look at this month, i would like the chart to stop the line after today and not keep a flat line. At he same time, when there is a weekend and therefore no sales, i want the chart to reflect this, and not create a sloped line from the beginning of the weekend to the end of the weekend.
I have been messing around with all this REALLY long now
Do i miss a certain concept? (very likely)
Hope my questions are clear.
Best regards
DP


