Automated Gantt Chart

riedyp

Board Regular
Joined
Feb 13, 2020
Messages
88
Office Version
  1. 365
Platform
  1. Windows
Hello,
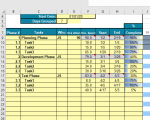
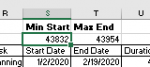
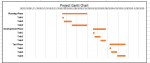
I am trying to make a gantt chart that will automatically update when the data is changed. More specifically I would like the bounds of the start and end date refer to the "Min Start" and "Max End" dates. I also am trying to get the data to only capture real values and not blank rows so it can be updated very easily but not sure if this is possible. The white chart references values in the yellow chart down to row 45. Please let me know if eithe rof these tasks are even possible, thank you.
 

Attachments

  • forum11.PNG
    forum11.PNG
    20.3 KB · Views: 19
  • forum12.PNG
    forum12.PNG
    35.1 KB · Views: 19

Excel Facts

Shade all formula cells
To shade all formula cells: Home, Find & Select, Formulas to select all formulas. Then apply a light fill color.
This code allows you to automatically update start and end dates:

VBA Code:
' sheet module
Private Sub Worksheet_Change(ByVal Target As Range) ' cells J17 and K17
Dim ch As ChartObject
If Target = [j17] Or Target = [k17] Then
    Set ch = ActiveSheet.ChartObjects("chart 4")
    ch.Chart.Axes(xlValue).MinimumScale = [j17]
    ch.Chart.Axes(xlValue).MaximumScale = [k17]
End If
End Sub
 
Upvote 0
Thank you, the code worked the first time i changed my values and it updated. However, when I switched my values back the chart did not update and now the code seems to get stuck. Do you have any suggestions for what may be the issue?
 

Attachments

  • help3.PNG
    help3.PNG
    57.7 KB · Views: 6
  • help4.PNG
    help4.PNG
    14.1 KB · Views: 6
Upvote 0
  • Remove any break points at VBE > Debug > clear all break points.
  • Note that this code is supposed to work automatically when one of the two cells changes, without any button clicking or manual macro execution.
If necessary, I can post my test workbook.
 
Upvote 0
I removed the breakpoints, but it is still not updating.
S2=min(S4:S40)
T2=min(T2:T40)
I am wondering if these having formulas are why it isn't updating since the formula remains the same but it is only displaying a different output.
I did not think that would make a difference but i am assuming that is the bug.
 

Attachments

  • min.PNG
    min.PNG
    1.7 KB · Views: 5
Upvote 0
New version:

VBA Code:
Private Sub Worksheet_Calculate()
Dim ch As ChartObject
Set ch = ActiveSheet.ChartObjects("chart 4")
ch.Chart.Axes(xlValue).MinimumScale = [j17]
ch.Chart.Axes(xlValue).MaximumScale = [k17]
End Sub
 
Upvote 0
Thank you, it now adjusts but if you look at the picture it offsets by just a bit much, any idea on how to adjust that?
 

Attachments

  • gantt.PNG
    gantt.PNG
    6.5 KB · Views: 9
Upvote 0
Can you post a link to your test workbook, with sensitive data changed?
 
Upvote 0

Forum statistics

Threads
1,214,920
Messages
6,122,267
Members
449,075
Latest member
staticfluids

We've detected that you are using an adblocker.

We have a great community of people providing Excel help here, but the hosting costs are enormous. You can help keep this site running by allowing ads on MrExcel.com.
Allow Ads at MrExcel

Which adblocker are you using?

Disable AdBlock

Follow these easy steps to disable AdBlock

1)Click on the icon in the browser’s toolbar.
2)Click on the icon in the browser’s toolbar.
2)Click on the "Pause on this site" option.
Go back

Disable AdBlock Plus

Follow these easy steps to disable AdBlock Plus

1)Click on the icon in the browser’s toolbar.
2)Click on the toggle to disable it for "mrexcel.com".
Go back

Disable uBlock Origin

Follow these easy steps to disable uBlock Origin

1)Click on the icon in the browser’s toolbar.
2)Click on the "Power" button.
3)Click on the "Refresh" button.
Go back

Disable uBlock

Follow these easy steps to disable uBlock

1)Click on the icon in the browser’s toolbar.
2)Click on the "Power" button.
3)Click on the "Refresh" button.
Go back
Back
Top