taigorchai
New Member
- Joined
- Aug 10, 2021
- Messages
- 3
- Office Version
- 365
- Platform
- Windows
| Extract all data in Summary sheet.xlsx | |||||||||
|---|---|---|---|---|---|---|---|---|---|
| B | C | D | E | F | G | H | |||
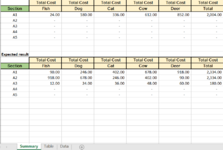
| 4 | Total Cost | Total Cost | Total Cost | Total Cost | Total Cost | Total Cost | |||
| 5 | Section | Fish | Dog | Cat | Cow | Deer | Total | ||
| 6 | A1 | 24.00 | 180.00 | 336.00 | 612.00 | 852.00 | 2,004.00 | ||
| 7 | A2 | - | - | - | - | - | - | ||
| 8 | A3 | - | - | - | - | - | - | ||
| 9 | A4 | - | - | - | - | - | - | ||
| 10 | A5 | - | - | - | - | - | - | ||
| 11 | |||||||||
| 12 | |||||||||
| 13 | Expected result | ||||||||
| 14 | Total Cost | Total Cost | Total Cost | Total Cost | Total Cost | Total Cost | |||
| 15 | Section | Fish | Dog | Cat | Cow | Deer | Total | ||
| 16 | A1 | 90.00 | 246.00 | 402.00 | 678.00 | 918.00 | 2,334.00 | ||
| 17 | A2 | 918.00 | 678.00 | 246.00 | 402.00 | 90.00 | 2,334.00 | ||
| 18 | A3 | 12.00 | 24.00 | 36.00 | 48.00 | 60.00 | 180.00 | ||
| 19 | A4 | - | - | - | - | - | - | ||
| 20 | A5 | - | - | - | - | - | - | ||
Summary | |||||||||
| Extract all data in Summary sheet.xlsx | ||||||||||||
|---|---|---|---|---|---|---|---|---|---|---|---|---|
| A | B | C | D | E | F | G | H | I | J | |||
| 7 | Section | Sales | ||||||||||
| 8 | A1 | |||||||||||
| 9 | Fish | Dog | Cat | Cow | Deer | Total | ||||||
| 10 | Jan-2021 | 2.00 | 15.00 | 28.00 | 51.00 | 71.00 | 167.00 | |||||
| 11 | Feb-2021 | 2.00 | 15.00 | 28.00 | 51.00 | 71.00 | 167.00 | |||||
| 12 | Mar-2021 | 2.00 | 15.00 | 28.00 | 51.00 | 71.00 | 167.00 | |||||
| 13 | Apr-2021 | 2.00 | 15.00 | 28.00 | 51.00 | 71.00 | 167.00 | |||||
| 14 | May-2021 | 2.00 | 15.00 | 28.00 | 51.00 | 71.00 | 167.00 | |||||
| 15 | Jun-2021 | 2.00 | 15.00 | 28.00 | 51.00 | 71.00 | 167.00 | |||||
| 16 | Jul-2021 | 2.00 | 15.00 | 28.00 | 51.00 | 71.00 | 167.00 | |||||
| 17 | Aug-2021 | 2.00 | 15.00 | 28.00 | 51.00 | 71.00 | 167.00 | |||||
| 18 | Sep-2021 | 2.00 | 15.00 | 28.00 | 51.00 | 71.00 | 167.00 | |||||
| 19 | Oct-2021 | 2.00 | 15.00 | 28.00 | 51.00 | 71.00 | 167.00 | |||||
| 20 | Nov-2021 | 2.00 | 15.00 | 28.00 | 51.00 | 71.00 | 167.00 | |||||
| 21 | Dec-2021 | 2.00 | 15.00 | 28.00 | 51.00 | 71.00 | 167.00 | |||||
| 22 | A1 | Total Cost | - | 24.00 | 180.00 | 336.00 | 612.00 | 852.00 | 2,004.00 | |||
| 23 | ||||||||||||
Table | ||||||||||||
| Cells with Data Validation | ||
|---|---|---|
| Cell | Allow | Criteria |
| B8 | List | =Data!$J$3:$J$5 |
Hello,
In "Table" sheet in cell B3 have drop down list. When select different section the figures in table will auto change. These figures are link from "Data" sheet.
Now my problem is in "Summary" sheet. This sheet is link from "Table" sheet with Index Match formula. When i select different Section in "Table" sheet the figure will auto change accordingly in "Summary" sheet.
In "Summary" sheet is there any way possible to make it to show ALL the figures no matter what i selected from the drop down list in "Table" sheet? so that those figures won't keep changing whenever i selected different section in "Table" sheet.
Those Section not available it will show Nil "-" example Section A4 and A5.
It would be great if can use formula to make it possible. Otherwise, would be fine if use Macro/VBA to solve this problem it.
Note:
1) in "Summary" sheet please pull figures from "Table" sheet directly and do not pull form "Data" sheet.
2) Please do not use Power Query and Office 365 formula version to solve this issue because this Excel file I need to share with non Office 365 user.
Thanks for your help.