Average Standard Deviation in Pivot Table for multiple entries

Shivi0189

New Member
Joined
Apr 1, 2019
Messages
8
I have data in the below format:

BOAT NOLOT NOD1D2D3D4D5STATUS
F4/337597310.610.5910.5910.5910.59ACC
F4/338597310.610.5810.5910.610.6ACC
F4/339591510.6110.6210.6110.6110.62ACC
F4/340598610.5910.5810.5910.5810.58ACC
F4/341591510.4710.4910.4810.4810.49ACC
F4/342591510.6110.6210.6410.4810.62ACC

<colgroup><col span="2"><col><col span="5"></colgroup><tbody>
</tbody>

I have made a pivot table where I have sort data as per lot no. I want to take average & stdev of entries in D1,...D5 for each lot no. spread in 5 columns, How to do that?
 

Excel Facts

Return population for a City
If you have a list of cities in A2:A100, use Data, Geography. Then =A2.Population and copy down.
like this?

AttributeValues
D1D2D3D4D5
LOT NOAverage of ValueStdDev of ValueAverage of ValueStdDev of ValueAverage of ValueStdDev of ValueAverage of ValueStdDev of ValueAverage of ValueStdDev of Value
5915​
10.56333333​
0.080829038​
10.57666667​
0.075055535​
10.57666667​
0.085049005​
10.52333333​
0.075055535​
10.57666667​
0.075055535​
5973​
10.6​
0​
10.585​
0.007071068​
10.59​
0​
10.595​
0.007071068​
10.595​
0.007071068​
5986​
10.59​
#DIV/0!​
10.58​
#DIV/0!​
10.59​
#DIV/0!​
10.58​
#DIV/0!​
10.58​
#DIV/0!​
 
Upvote 0
like this?

AttributeValues
D1D2D3D4D5
LOT NOAverage of ValueStdDev of ValueAverage of ValueStdDev of ValueAverage of ValueStdDev of ValueAverage of ValueStdDev of ValueAverage of ValueStdDev of Value
5915​
10.56333333​
0.080829038​
10.57666667​
0.075055535​
10.57666667​
0.085049005​
10.52333333​
0.075055535​
10.57666667​
0.075055535​
5973​
10.6​
0​
10.585​
0.007071068​
10.59​
0​
10.595​
0.007071068​
10.595​
0.007071068​
5986​
10.59​
#DIV/0!​
10.58​
#DIV/0!​
10.59​
#DIV/0!​
10.58​
#DIV/0!​
10.58​
#DIV/0!​

<tbody>
</tbody>


No. I want only one average & stdev value for all 5 attributes(D1,D2,D3,D4,D5) against every lot no.
 
Upvote 0
like this?

LOT NOAverage of ValueStdDev of Value
5915​
10.56333333​
0.069556418​
5973​
10.593​
0.006749486​
5986​
10.584​
0.005477226​
 
Upvote 0
so use PowerQuery (Get&Transform)...
load your source table into PQ editor, select D columns, from the ribbon - Transform - Unpivot columns select Unpivot Only Selected Columns
then Close&Load as Connection
---
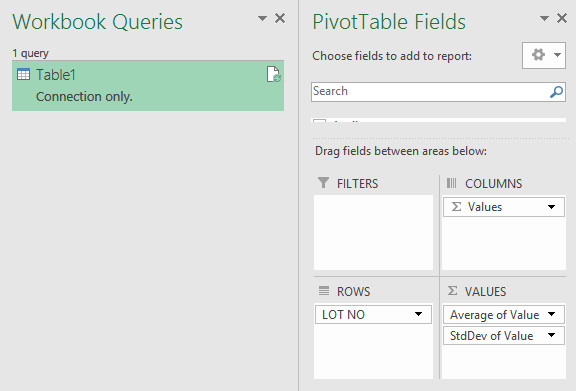
from Insert - PivotTable choose: use an external data source then Choose Connection and Query - Table1 (Open - OK)
put Lot No into ROWS Area, Value into the VALUES Area twice, one for Average, second for StdDev

PQPT.jpg
 
Upvote 0

Forum statistics

Threads
1,214,534
Messages
6,120,086
Members
448,944
Latest member
sharmarick

We've detected that you are using an adblocker.

We have a great community of people providing Excel help here, but the hosting costs are enormous. You can help keep this site running by allowing ads on MrExcel.com.
Allow Ads at MrExcel

Which adblocker are you using?

Disable AdBlock

Follow these easy steps to disable AdBlock

1)Click on the icon in the browser’s toolbar.
2)Click on the icon in the browser’s toolbar.
2)Click on the "Pause on this site" option.
Go back

Disable AdBlock Plus

Follow these easy steps to disable AdBlock Plus

1)Click on the icon in the browser’s toolbar.
2)Click on the toggle to disable it for "mrexcel.com".
Go back

Disable uBlock Origin

Follow these easy steps to disable uBlock Origin

1)Click on the icon in the browser’s toolbar.
2)Click on the "Power" button.
3)Click on the "Refresh" button.
Go back

Disable uBlock

Follow these easy steps to disable uBlock

1)Click on the icon in the browser’s toolbar.
2)Click on the "Power" button.
3)Click on the "Refresh" button.
Go back
Back
Top