Baffled with basic chart - Clustered Column

my8950

Board Regular
Joined
May 1, 2009
Messages
162
I am trying to make a basic chart and really struggling with getting to show what I am after.
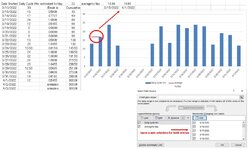
The selection I chose is Clustered Column – Line.
What I want to show is, columns of my daily hours, in Columns.
X axis is the date, Y axis is the daily hour number.
Each day has it’s own entry.
This part is doing what I want it to.
For the line portion is where the trouble is.
I’ve got the start date in one cell, and the and an average of the hours above it for the entire selection.
Next to that I have the current date and the same calculation for the hours above that.
This should just make a straight horizontal line across the chart, the date axis is the same for the charts.
The graph will only show the line portion over the first two dates it seems, the line should go from 3-15 through 4-1 on the graph.

Ideas on what I am doing wrong?
Maybe there is a better chart selection?
I'm baffled
 

Attachments

  • Capture.JPG
    Capture.JPG
    106.4 KB · Views: 8

Excel Facts

How to create a cell-sized chart?
Tiny charts, called Sparklines, were added to Excel 2010. Look for Sparklines on the Insert tab.
Ahhh...Ok, If I make an extra column, and it contains 18 counts, same as the dates, it will make the line.
Why won't it make a line with two entries, start date and finish date?
Two date entries and two hour entries that span the same time, 3/15-4/1?
 
Upvote 0
Ahhh...Ok, If I make an extra column, and it contains 18 counts, same as the dates, it will make the line.
Why won't it make a line with two entries, start date and finish date?
Two date entries and two hour entries that span the same time, 3/15-4/1?
In most simple charts, the X values for the first series are used for all series. Even though the line chart series has the first and last dates for its X values, it uses the first two dates from the column chart series because it only has two points.

But here's what else you could do. I created a column chart (first chart below) from the blue shaded data. I copied the orange shaded data, selected the chart, and used Paste Special to add it as a new series, name is first row, categories in first column (second chart below). If I change the series type of the added series to a line, I get a line spanning the first two columns only (third chart). But I can change the added series to an XY Scatter type, and then uncheck the Secondary Axis box that Excel helpfully checked, and I get a line that spans all of the points (fourth chart).

Column-Average-LineOrXY.png
 
Upvote 0
Solution
Ok, I did get it to work based on what information you provided. It didn't go as smooth as it was to read though.
I forgot to mention I am using Excel 2013 I believe.
But, it did finally show up as I am looking for.
Thank you for your assistance!!!
 
Upvote 0
In this case, Excel version doesn't matter, This would work with any version from Excel 97 (maybe earlier) until the latest Microsoft 365 release.
 
Upvote 0

Forum statistics

Threads
1,214,950
Messages
6,122,436
Members
449,083
Latest member
Ava19

We've detected that you are using an adblocker.

We have a great community of people providing Excel help here, but the hosting costs are enormous. You can help keep this site running by allowing ads on MrExcel.com.
Allow Ads at MrExcel

Which adblocker are you using?

Disable AdBlock

Follow these easy steps to disable AdBlock

1)Click on the icon in the browser’s toolbar.
2)Click on the icon in the browser’s toolbar.
2)Click on the "Pause on this site" option.
Go back

Disable AdBlock Plus

Follow these easy steps to disable AdBlock Plus

1)Click on the icon in the browser’s toolbar.
2)Click on the toggle to disable it for "mrexcel.com".
Go back

Disable uBlock Origin

Follow these easy steps to disable uBlock Origin

1)Click on the icon in the browser’s toolbar.
2)Click on the "Power" button.
3)Click on the "Refresh" button.
Go back

Disable uBlock

Follow these easy steps to disable uBlock

1)Click on the icon in the browser’s toolbar.
2)Click on the "Power" button.
3)Click on the "Refresh" button.
Go back
Back
Top