Bar Graph - Show count and percentage per person vs group

Ananthak275

Board Regular
Joined
Aug 22, 2020
Messages
128
Office Version
  1. 2013
Platform
  1. Windows
  2. MacOS
hello everyone,

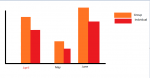
I'm trying to create a bar graph that contains two types of data - per person and group beside each other. The individual section would have a slicer so that a comparison of each individual vs the group can be completed, as long as the slicer doesnt impact the group bar. the screen shot is something im trying to create. my data is currently like this;

AssignedCreatedClosedHow many days it took
Person 1May 13, 2020May 20, 20207
Person 2May 13, 2020May 18, 20205
Person 3April 14, 2020April 20, 20206
Person 4April 1, 2020April 10, 20209
Person 1June 3rd, 2020June 25, 202022
Person 1June 15, 2020June 16, 20201
Person 2May 1, 2020May 3rd, 20202
Person 3June 28, 2020June 29, 20201
 

Attachments

  • Screen Shot 2020-08-22 at 7.24.02 PM.png
    Screen Shot 2020-08-22 at 7.24.02 PM.png
    10.1 KB · Views: 8

Excel Facts

Do you hate GETPIVOTDATA?
Prevent GETPIVOTDATA. Select inside a PivotTable. In the Analyze tab of the ribbon, open the dropown next to Options and turn it off
Hi,

As you want to slice by the individual, then the first part of the bar graph is easy - simply drag the value field into the bar chart. I suspect that the value field will be "How many days it took" column. With that, every time you select a different individual, the value will automatically update.

The second part is where you need to create a DAX measure so that it always ignores your Person selection. For example, if your Group shows the average of days, you can calculate something similar to:

Rich (BB code):
mGroup =
    CALCULATE(
        AVG(table[How many days it took]),
        ALL(table[Assigned])
    )
 
Upvote 0

Forum statistics

Threads
1,214,925
Messages
6,122,303
Members
449,078
Latest member
nonnakkong

We've detected that you are using an adblocker.

We have a great community of people providing Excel help here, but the hosting costs are enormous. You can help keep this site running by allowing ads on MrExcel.com.
Allow Ads at MrExcel

Which adblocker are you using?

Disable AdBlock

Follow these easy steps to disable AdBlock

1)Click on the icon in the browser’s toolbar.
2)Click on the icon in the browser’s toolbar.
2)Click on the "Pause on this site" option.
Go back

Disable AdBlock Plus

Follow these easy steps to disable AdBlock Plus

1)Click on the icon in the browser’s toolbar.
2)Click on the toggle to disable it for "mrexcel.com".
Go back

Disable uBlock Origin

Follow these easy steps to disable uBlock Origin

1)Click on the icon in the browser’s toolbar.
2)Click on the "Power" button.
3)Click on the "Refresh" button.
Go back

Disable uBlock

Follow these easy steps to disable uBlock

1)Click on the icon in the browser’s toolbar.
2)Click on the "Power" button.
3)Click on the "Refresh" button.
Go back
Back
Top