Hi lovelies!
I'm using Excel 365.
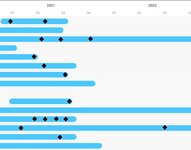
Below is a mock-up of my data. Essentially, I want a Gantt Chart made up of the Start to End Date, then I want the Milestones placed as makers along the timeline bar.
Is this possible? I've tried the built in Line Charts, and I've tried the Online Gantt templates, but without success; maybe just haven't found the right one, or maybe I need an add-on?
Thank you so much!
I'm using Excel 365.
Below is a mock-up of my data. Essentially, I want a Gantt Chart made up of the Start to End Date, then I want the Milestones placed as makers along the timeline bar.
Is this possible? I've tried the built in Line Charts, and I've tried the Online Gantt templates, but without success; maybe just haven't found the right one, or maybe I need an add-on?
| Number | Name | Phase | Start Date | End Date | Milestone 1 | Milestone 2 | Milestone 3 | Milestone 4 | Milestone 5 |
| PJ00001 | Project A | Realization | 12/01/2020 | 12/07/2021 | 07/01/2021 | ||||
| PJ00002 | Project B | Stabilization | 07/01/2019 | 06/30/2020 | 06/01/2020 | ||||
| PJ00003 | Project C | Realization | 01/01/2021 | 08/31/2021 | 06/07/2021 | 07/12/2021 | |||
| PJ00004 | Project D | Concept | 05/01/2018 | 09/30/2021 | 07/01/2021 | ||||
| PJ00005 | Project E | Preparation | 06/01/2019 | 09/30/2021 | |||||
| PJ00006 | Project F | Implementation | 03/01/2019 | 12/31/2021 | 07/01/2021 | ||||
| PJ00007 | Project G | Realization | 04/01/2019 | 12/31/2022 | 07/30/2020 | 06/21/2021 | 08/30/2021 | 08/31/2020 | 07/01/2021 |
Thank you so much!