Calculate a rolled up average (baseline) to compare against other weeks.

AT1

New Member
Joined
Feb 27, 2020
Messages
5
Office Version
  1. 2016
Platform
  1. Windows
I am using Excel 2016 and need a PowerPivot solution for the following situation.

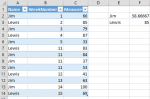
I have a table with 5 columns. The names (and data types) of each column: Name (text), WeekNumber (int), DatePosted (date), Weekend (date), Measure (int).
The WeekNumber column represent the week number of the corresponding DatePosted date.

Table:

Capture1.PNG


Desired output:
I need a DAX formula to calculate the average of Measure in the table above for weeks 1-11 as a baseline and compare against the week 12 average, week 13 average and so on.

I am not certain how to capture the average for only weeks 1-11, as weeks 12, 13, 14 and so on are also in the dataset.

The numerical values in white are simple SUMs. I need to create a formula that I could use in a pivot table that represents the value(s) in Q (the average of week 1-11) for each Name.


Capture2.PNG


Thank you.
 

Excel Facts

Is there a shortcut key for strikethrough?
Ctrl+S is used for Save. Ctrl+5 is used for Strikethrough. Why Ctrl+5? When you use hashmarks to count |||| is 4, strike through to mean 5.
Hi,

I have used a simplified version of your dataset, but that should do the trick. As you can see, my average for weeks 1-11 is 67.44.

1585062402885.png


You can then create DAX measure to calculate average only for weeks 1-11:

Rich (BB code):
Avg1-11 = 
    CALCULATE(
        AVERAGE(Table1[Measure]),
        FILTER(ALL(Table1), Table1[WeekNumber] <= 11)
    )

Here's the final result (table in PowerBI):

1585062762392.png
 
Upvote 0
Thanks, that is very close to the result I am looking for. Is there a way to show in the Avg1-11 column the result by Name? So, for each Jim row it would show 59 in Avg1-11 column and Lewis would show 85?

Capture3.PNG
 
Upvote 0
Sure :)
ALLEXCEPT will ignore all filters except for the [Name] column.

Rich (BB code):
Avg1-11 =
    CALCULATE(
        AVERAGE(Table1[Measure]),
        FILTER(ALLEXCEPT(Table1, Table1[Name]), Table1[WeekNumber] <= 11)
    )

1585075473579.png
 

Attachments

  • 1585075444317.png
    1585075444317.png
    16.4 KB · Views: 7
Upvote 0
Yes this also works perfectly. Lastly (thank you for your patience), what if I want to sum the weeks (middle section in the image) for Jim and Lewis before coming up with the average, and then displaying the baseline Avg1-11 in column Q? I tried to alter your last formula using SUM but no luck.

Capture.PNG
 
Upvote 0
Hey,

I think you are looking for this formula - give it a try:

Rich (BB code):
Sum of WeekNumber =
    CALCULATE(
        SUM(Table1[Measure]),
        ALLEXCEPT(Table1, Table1[Name], Table1[WeekNumber]))

1585136023205.png
 
Upvote 0

Forum statistics

Threads
1,214,567
Messages
6,120,268
Members
448,953
Latest member
Dutchie_1

We've detected that you are using an adblocker.

We have a great community of people providing Excel help here, but the hosting costs are enormous. You can help keep this site running by allowing ads on MrExcel.com.
Allow Ads at MrExcel

Which adblocker are you using?

Disable AdBlock

Follow these easy steps to disable AdBlock

1)Click on the icon in the browser’s toolbar.
2)Click on the icon in the browser’s toolbar.
2)Click on the "Pause on this site" option.
Go back

Disable AdBlock Plus

Follow these easy steps to disable AdBlock Plus

1)Click on the icon in the browser’s toolbar.
2)Click on the toggle to disable it for "mrexcel.com".
Go back

Disable uBlock Origin

Follow these easy steps to disable uBlock Origin

1)Click on the icon in the browser’s toolbar.
2)Click on the "Power" button.
3)Click on the "Refresh" button.
Go back

Disable uBlock

Follow these easy steps to disable uBlock

1)Click on the icon in the browser’s toolbar.
2)Click on the "Power" button.
3)Click on the "Refresh" button.
Go back
Back
Top