excelinrealestate
New Member
- Joined
- Jan 9, 2023
- Messages
- 1
- Office Version
- 365
- Platform
- Windows
Hello!
I'm having trouble creating a spreadsheet that will calculate correctly.
Our commission structure is set up as follows:
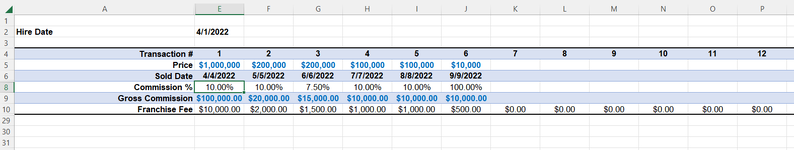
We take 10% of the total commission received per sale (our "FF"), 90% goes back to the employee. However, once the employee has contributed $15k, our FF goes down to 5%. This is based on a year-over-year rollover based on the employee's start date.
So, if John Smith is hired on 05/01/2021 and his first sale pays $10,000, Smith keeps $9,000 and pays $1,000 to Company. On 04/01/2022, John Smith has paid $15,000 to the Company. On 04/02/2022, John Smith's nth sale pays $10,000. On this sale, John Smith keeps $9,500 and pays $500 to Company. As of 05/02/2022, his Company contribution resets to zero.
I've been pretty close on the formula, the issue I have is at the turnover point. John Smith pays 10% on commissions up to a company contribution of $15,000. But if he's contributed $14,500 as of 03/01/22 and his next commission check is $10,000, then I don't want the commission to calculate at 10% of the $10k ($9k to John and $1k to us) because the 10% is only charged UP TO his $15k company contribution. He should pay us 10% of the first $5k (so his total annual company contribution is now $15,000) and then should pay us 5% on the second $5k (because he's hit the rollover point).
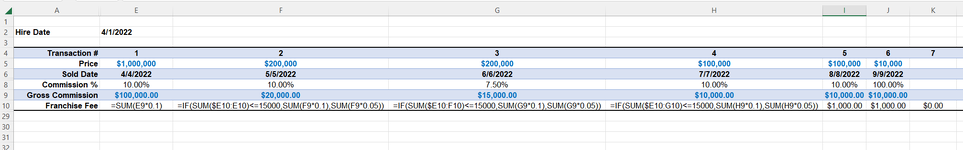
Current Cell Formulas:
E10 =SUM(E9*0.1)
F10 =IF(SUM($E10:E10)<=15000,SUM(F9*0.1),SUM(F9*0.05))
G10 =IF(SUM($E10:F10)<=15000,SUM(G9*0.1),SUM(G9*0.05))
How do I rewrite the formulas to take into account the rollover point without having a circular formula issue?
I'm aware I'm probably going to need to bring the Hire Dates into the formula, but I haven't figured out how to do that yet.
Can anyone help me with this?
I'm having trouble creating a spreadsheet that will calculate correctly.
Our commission structure is set up as follows:
We take 10% of the total commission received per sale (our "FF"), 90% goes back to the employee. However, once the employee has contributed $15k, our FF goes down to 5%. This is based on a year-over-year rollover based on the employee's start date.
So, if John Smith is hired on 05/01/2021 and his first sale pays $10,000, Smith keeps $9,000 and pays $1,000 to Company. On 04/01/2022, John Smith has paid $15,000 to the Company. On 04/02/2022, John Smith's nth sale pays $10,000. On this sale, John Smith keeps $9,500 and pays $500 to Company. As of 05/02/2022, his Company contribution resets to zero.
I've been pretty close on the formula, the issue I have is at the turnover point. John Smith pays 10% on commissions up to a company contribution of $15,000. But if he's contributed $14,500 as of 03/01/22 and his next commission check is $10,000, then I don't want the commission to calculate at 10% of the $10k ($9k to John and $1k to us) because the 10% is only charged UP TO his $15k company contribution. He should pay us 10% of the first $5k (so his total annual company contribution is now $15,000) and then should pay us 5% on the second $5k (because he's hit the rollover point).
Current Cell Formulas:
E10 =SUM(E9*0.1)
F10 =IF(SUM($E10:E10)<=15000,SUM(F9*0.1),SUM(F9*0.05))
G10 =IF(SUM($E10:F10)<=15000,SUM(G9*0.1),SUM(G9*0.05))
How do I rewrite the formulas to take into account the rollover point without having a circular formula issue?
I'm aware I'm probably going to need to bring the Hire Dates into the formula, but I haven't figured out how to do that yet.
Can anyone help me with this?