NOTE: I just read about the XL2BB addin and will install it (have to get IT to do it) so i can upload if necessary but my question isn't how do I do this but can it be done and if so what would you use (ie Pivot table, chart, other). i want to learn this for myself but with as vast as Excel is I don't want to waste a lot of time learning about something that can't be used to solve the current problem.
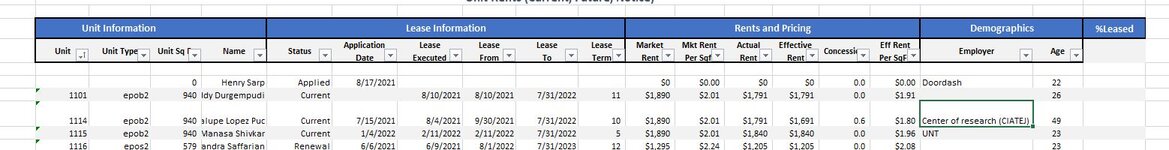
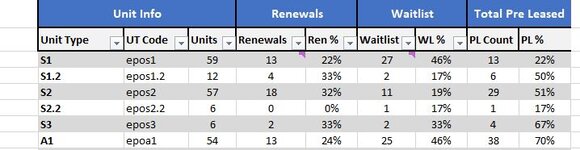
I may not have worded this the best way possible but my goal is to provide a summary of values on one worksheet from many rows on a Detail worksheet. The issue is I don't know if this can be done when different logic is applied to each column. I took screenshots of the Detail and what the summary should look to help better explain. The first Image is of the first few rows (too many rows and too large an image) that contains the details, 1 row of 18 columns of data varying in type, some text some numbers ect. Image 2 is the Summary of that data and its grouped 9the first column) by the value in Column D on the Details tab, the Unit Type. This I know can be done such as a Count of the number of Units, count of rows on the Details sheet, where the value for Unit Type is the same.
What I'm not sure can be done is when logic of some of the columns is more complex than a simple aggregation. For example column G (labeled Waitlist) on the Summary tab is a Count of units but unlike the count of Units as shown in Column D on the Summary this is a count of Units where the text in column C on the Details sheet is like waitXXXX where XXXX is anything. So this count is a subset of the Units count based on a pattern match of text in another column.
Does this sound like something that can be done in Excel and if so what would it be? Pivot? Chart? other? I don't need the details of how to do it exactly I just need to be steered into the right direction because i want to learn it myself and I have a LinkedInLearning subscription.
Thanks for taking the time to review my post and respond.