Can I manipulate chart to adjust values in a table?

lithium_s

New Member
Joined
Feb 6, 2020
Messages
7
Office Version
  1. 2016
Platform
  1. Windows
Hi, I have plotted a circle in a scatter graph and added the points A, B, C and D. I can plot these points at the angle specified in the table.

I was wondering if this could work the other way around? As in, I physically move the plotted point to the desired point on the circle and this updates the angle figure in the table?

I'm almost certain I have seen this done in excel, but i cannot find anything like it.

Thanks
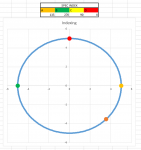
circle plot.PNG
 

Excel Facts

Spell Check in Excel
Press F7 to start spell check in Excel. Be careful, by default, Excel does not check Capitalized Werds (whoops)
I have found that this used to be a feature in excel called MPOC. I can remember using it. Shame it's no longer there.
 
Upvote 0

Forum statistics

Threads
1,214,815
Messages
6,121,715
Members
449,049
Latest member
THMarana

We've detected that you are using an adblocker.

We have a great community of people providing Excel help here, but the hosting costs are enormous. You can help keep this site running by allowing ads on MrExcel.com.
Allow Ads at MrExcel

Which adblocker are you using?

Disable AdBlock

Follow these easy steps to disable AdBlock

1)Click on the icon in the browser’s toolbar.
2)Click on the icon in the browser’s toolbar.
2)Click on the "Pause on this site" option.
Go back

Disable AdBlock Plus

Follow these easy steps to disable AdBlock Plus

1)Click on the icon in the browser’s toolbar.
2)Click on the toggle to disable it for "mrexcel.com".
Go back

Disable uBlock Origin

Follow these easy steps to disable uBlock Origin

1)Click on the icon in the browser’s toolbar.
2)Click on the "Power" button.
3)Click on the "Refresh" button.
Go back

Disable uBlock

Follow these easy steps to disable uBlock

1)Click on the icon in the browser’s toolbar.
2)Click on the "Power" button.
3)Click on the "Refresh" button.
Go back
Back
Top