There's two things going on here.
One is having the months sequential, with a separate entry for each "System".
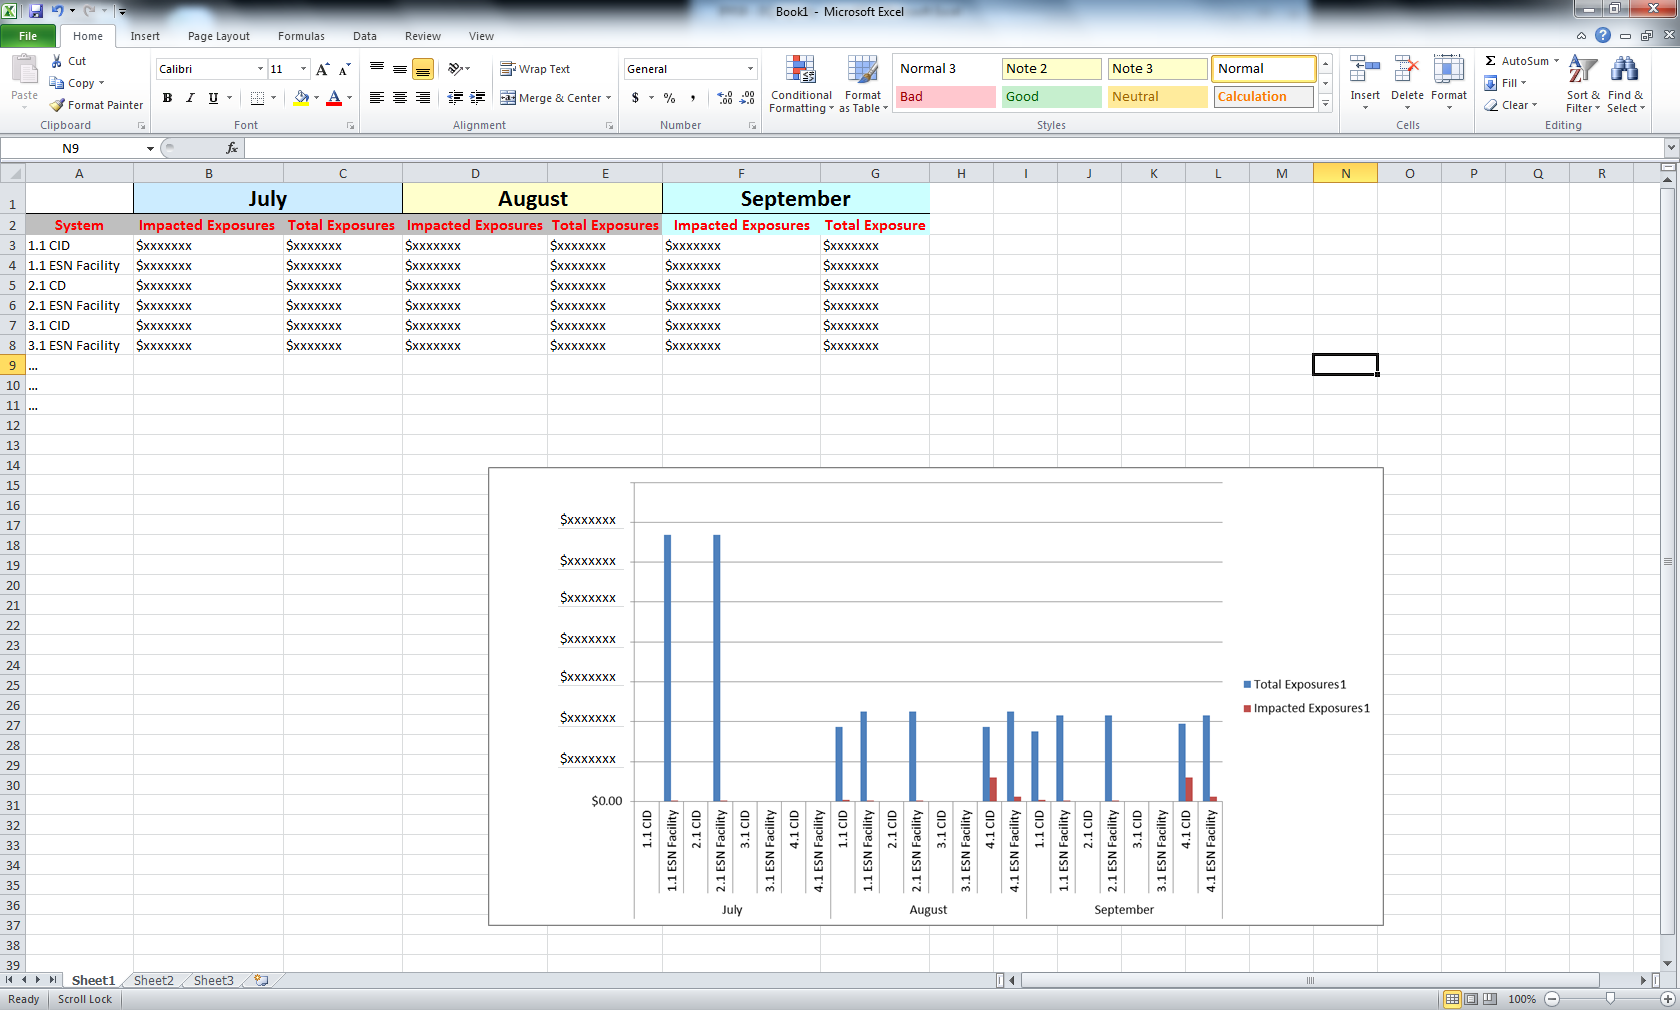
The other is two lines on your X axis - one for System, one for month.
The first is easy, and is driven simply by your data layout.
Try moving the data for August, that is currently in D3:E8, into the range B9:C14, and then move September below that, into B15:C20.
If you don't want to do this to your actual data sheet, because you need to preserve the layout for some reason, then set up some other area in your worksheet that has the data laid out in this way, and make your chart depend on THAT area.
The second thing, with the two lines for the X axis, I've never done it myself, but try this...
https://peltiertech.com/chart-with-a-dual-category-axis/
")


