auroralily
New Member
- Joined
- Sep 13, 2014
- Messages
- 24
Hi
I have received a lot of great help in the last week for this project and I was hoping that I could get some help again. I'm using excel 2007 at home and 2010 at work.
I have produced a workbook with charts of student data (named Test Graphs), the charts get their data from another file (named Test Data):
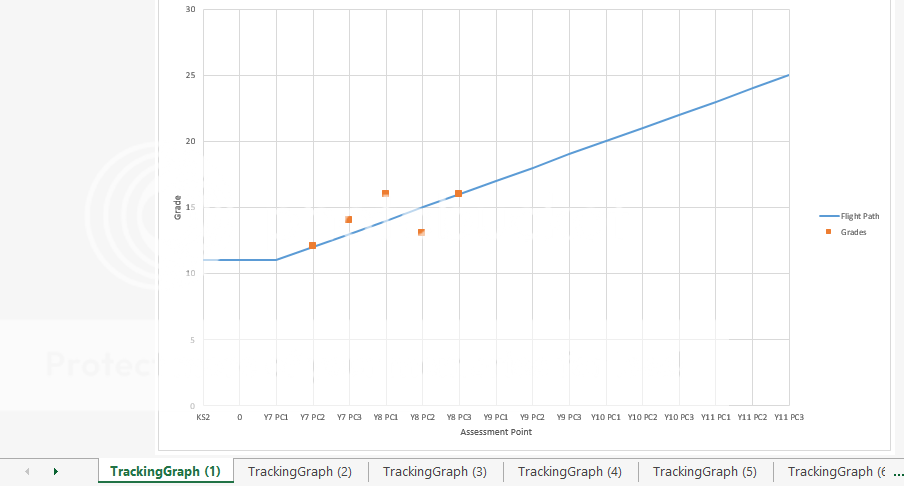
There are 35 charts in the "Test Graphs" workbook which is theoretically bigger than any class will be but the number could be higher. If the class size is less than 35 the unused charts will be hidden.
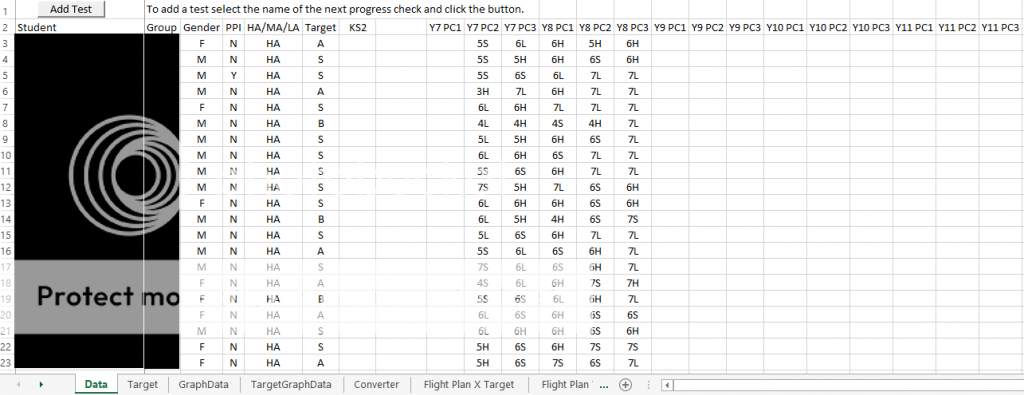
The marker style of the "Grades" series will be dependent on the value in column C (eg if Gender = M, style = triangle). This is a screenshot of the "Data" sheet:
Tracking Graph (1) will get it's gender information from row 3 (C3) in the "Data" sheet.
What I would like is a macro that does the following when run:
Thanks again for all the help I've already received.
I have received a lot of great help in the last week for this project and I was hoping that I could get some help again. I'm using excel 2007 at home and 2010 at work.
I have produced a workbook with charts of student data (named Test Graphs), the charts get their data from another file (named Test Data):
There are 35 charts in the "Test Graphs" workbook which is theoretically bigger than any class will be but the number could be higher. If the class size is less than 35 the unused charts will be hidden.
The marker style of the "Grades" series will be dependent on the value in column C (eg if Gender = M, style = triangle). This is a screenshot of the "Data" sheet:
Tracking Graph (1) will get it's gender information from row 3 (C3) in the "Data" sheet.
What I would like is a macro that does the following when run:
- Change the marker style on all charts that satisfy the condition: if gender = M
- Activate the print function (eg act like the user has pressed ctrl p)
Thanks again for all the help I've already received.


