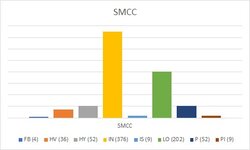
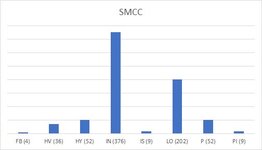
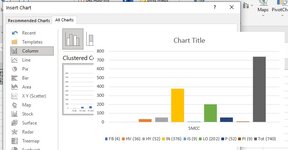
I'm creating a very simple chart to show a variety of classroom modalities and how many of each type we are offering. When I run the chart manually I get "The right one.jpg". But when I run it with VBA I get "The wrong one.jpg" (notice that it is all blue and has thinner stacks.) I recorded the following macro by manually creating the chart choosing "The correct chart.jpg." When I stepped through the process while recording "The right one.jpg" was the result. But when I run the macro it results in the "The wrong one.jpg."
Here's the macro I recorded:
Sub Macro1()
Range("A1:I2").Select
ActiveSheet.Shapes.AddChart2(201, xlColumnClustered).Select
ActiveChart.SetSourceData Source:=Range("Charts!$A$1:$I$2")
Range("P6").Select
ActiveSheet.ChartObjects("Chart 1").Activate
End Sub
Here's the data I used and is in my spreadsheet at $A$1:$I$2:
| FB (4) | HV (36) | HY (52) | IN (376) | IS (9) | LO (202) | P (52) | PI (9) | Tot (740) | |
| SMCC | 4 | 36 | 52 | 376 | 9 | 202 | 52 | 9 | 740 |