stevebards
New Member
- Joined
- Oct 13, 2022
- Messages
- 2
- Office Version
- 365
- Platform
- Windows
Hi,
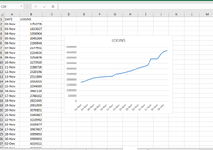
I am having a bizarre situation where I am tracking website logins and have a very simple table but for 2 days the chart is displaying a number that doesn't match the data.
This is the data:
This is the chart:

Any ideas what could be causing this? I'm on the latest version of Excel and all the formatting of the cells is consistent as numbers.
Thanks.
I am having a bizarre situation where I am tracking website logins and have a very simple table but for 2 days the chart is displaying a number that doesn't match the data.
This is the data:
02-Nov | 1,753,776 |
03-Nov | 1,813,027 |
04-Nov | 1,958,904 |
05-Nov | 2,045,264 |
06-Nov | 2,169,844 |
07-Nov | 2,177,931 |
08-Nov | 2,224,836 |
09-Nov | 2,254,878 |
10-Nov | 2,273,920 |
11-Nov | 2,288,726 |
12-Nov | 2,320,196 |
13-Nov | 2,511,884 |
14-Nov | 2,552,015 |
15-Nov | 2,594,089 |
16-Nov | 2,661,120 |
17-Nov | 2,748,102 |
18-Nov | 2,821,045 |
19-Nov | 2,951,959 |
20-Nov | 3,070,851 |
21-Nov | 3,145,687 |
22-Nov | 3,218,982 |
23-Nov | 3,325,677 |
17-Nov | 3,907,407 |
28-Nov | 3,909,693 |
30-Nov | 3,909,693 |
02-Dec | 4,319,311 |
04-Dec | 4,582,875 |
05-Dec | 4,685,342 |
This is the chart:
Any ideas what could be causing this? I'm on the latest version of Excel and all the formatting of the cells is consistent as numbers.
Thanks.
")


