Chart not updating when value on dropdown changes

espinozr

New Member
Joined
Jun 4, 2019
Messages
18
Office Version
  1. 365
Platform
  1. Windows
Hello,

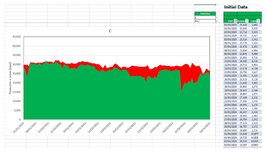
I would like to plot data using two different dropdown menus.
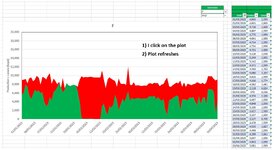
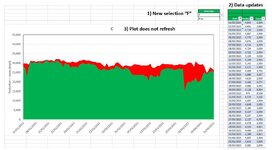
When I select any item on either dropdown menu the table gets updated, but the actual plot does not refresh unless:
  • I click anywhere on it
  • I manually type the data and press enter
  • I click on another tab and come back to the same tab
  • I minimise and then maximise the excel window
  • I press F9
The odd thing is that if I select one item from the menu, nothing happens, but if I then select another item, the plot refreshes to the previous item selected. It's always one step behind unless I do any of points I mentioned above.

The calculation is automatic and I can see the data changing in the table, so it is not a calculation problem.
The data has 1212 rows and 3 columns (date, x, y) which I don't think it's a lot. Could this be a memory issue?

Unfortunately, I cannot post a mini-sheet, this is a business computer and I cannot install any add-in. Is there a way to attached the file?

I'm attaching a few screenshot,

thanks,
 

Attachments

  • screenshot 3.JPG
    screenshot 3.JPG
    132.1 KB · Views: 9
  • screenshot 2.JPG
    screenshot 2.JPG
    124.8 KB · Views: 9
  • screenshot 1.JPG
    screenshot 1.JPG
    124.5 KB · Views: 8

Excel Facts

Excel Joke
Why can't spreadsheets drive cars? They crash too often!
No idea why the chart doesn't update. If the dropdown cell is data validation and it is ok for you to use vba, you could use this workaround and see if it fixes the issue until you figure out the actual problem.

The code assumes the cell with the data validation dropdown is cell A1... Change it as needed.

In the worksheet Module :
VBA Code:
Private Sub Worksheet_Change(ByVal Target As Range)
    Const CELL_ADDRESS = "A1" ' <---- change as required
    Static vPrevVal As Variant
    If Not Intersect(Range(CELL_ADDRESS), Target) Is Nothing Then
        If Range(CELL_ADDRESS).Value <> vPrevVal Then
            Me.Calculate
        End If
        vPrevVal = Range(CELL_ADDRESS).Value
    End If
End Sub
 
Upvote 0
No idea why the chart doesn't update. If the dropdown cell is data validation and it is ok for you to use vba, you could use this workaround and see if it fixes the issue until you figure out the actual problem.

The code assumes the cell with the data validation dropdown is cell A1... Change it as needed.

In the worksheet Module :
VBA Code:
Private Sub Worksheet_Change(ByVal Target As Range)
    Const CELL_ADDRESS = "A1" ' <---- change as required
    Static vPrevVal As Variant
    If Not Intersect(Range(CELL_ADDRESS), Target) Is Nothing Then
        If Range(CELL_ADDRESS).Value <> vPrevVal Then
            Me.Calculate
        End If
        vPrevVal = Range(CELL_ADDRESS).Value
    End If
End Sub
Thanks for your help. This does work.
However, I would prefer to find a solution within Excel without using VBA macros.

I did many tests, and it really seems like a refresh issue, but I cannot figure out what's the issue. I tried reducing the number of rows, changing the type of plot, etc, and the result is always the same.

Any other ideas?
 
Upvote 0
Just a stab in the dark.

Add a volatile function to some cell in the worksheet (=Now() should do) and then add one data label to one of the chart data series and embeed inside the data label a reference to the cell that has the volatile function... You can resize the data label to make it as small as posible so it is not visible.

Untitlefgdfgd.png


Maybe this could trigger an update of the chart w/ using vba.
 
Upvote 0
Just a stab in the dark.

Add a volatile function to some cell in the worksheet (=Now() should do) and then add one data label to one of the chart data series and embeed inside the data label a reference to the cell that has the volatile function... You can resize the data label to make it as small as posible so it is not visible.

View attachment 90119

Maybe this could trigger an update of the chart w/ using vba.
Hi, no luck with this one.

As you suggested, I used the now() function and I assigned it to the label. When I select a new entry, the data in the table and the cell with the volatile function update, but the plot doesn't refresh (unless I do any of the actions I mentioned above).

I sent the file to a friend, and it works flawlessly for him... so it seems that it's a problem with my laptop. Very odd, because it only happens with that plot, in that file. I haven't encountered any issue elsewhere in Excel.
 
Upvote 0

Forum statistics

Threads
1,214,834
Messages
6,121,877
Members
449,056
Latest member
ruhulaminappu

We've detected that you are using an adblocker.

We have a great community of people providing Excel help here, but the hosting costs are enormous. You can help keep this site running by allowing ads on MrExcel.com.
Allow Ads at MrExcel

Which adblocker are you using?

Disable AdBlock

Follow these easy steps to disable AdBlock

1)Click on the icon in the browser’s toolbar.
2)Click on the icon in the browser’s toolbar.
2)Click on the "Pause on this site" option.
Go back

Disable AdBlock Plus

Follow these easy steps to disable AdBlock Plus

1)Click on the icon in the browser’s toolbar.
2)Click on the toggle to disable it for "mrexcel.com".
Go back

Disable uBlock Origin

Follow these easy steps to disable uBlock Origin

1)Click on the icon in the browser’s toolbar.
2)Click on the "Power" button.
3)Click on the "Refresh" button.
Go back

Disable uBlock

Follow these easy steps to disable uBlock

1)Click on the icon in the browser’s toolbar.
2)Click on the "Power" button.
3)Click on the "Refresh" button.
Go back
Back
Top