Chart with lines connecting 2 different X Y points

JugglerJAF

Active Member
Joined
Feb 17, 2002
Messages
297
Office Version
  1. 365
Platform
  1. Windows
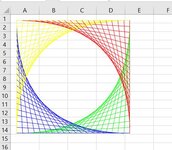
I'm trying to figure out how to re-create in Excel those curves that everyone drew as a kid by connecting points on an X and Y axis. One of these:
curve.jpg


For example, I want to plot:
  • point 0,5 and connect it with a line to the point 1,0
  • point 0,4 and connect it with a line to the point 2,0
  • point 0,3 and connect it with a line to the point 3,0
  • point 0,2 and connect it with a line to the point 4,0
  • point 0,1 and connect it with a line to the point 5,0
I've tried a few layouts and approaches, line charts and XY Scatter charts, but I can't get it to plot the points and connecting lines as I want. I'm sure there's a simple way to do this, but I can't figure it out. Help!!
 

Excel Facts

Shade all formula cells
To shade all formula cells: Home, Find & Select, Formulas to select all formulas. Then apply a light fill color.
PatternWithLines.JPG


Hello - JugglerJAF - You might try something like the code below. Hope this helps.

VBA Code:
Sub PatternWithLines()
Set myDocument = Worksheets(1)
i = 10
While i < 200
'AddLine(Begin X, Begin Y, End X, End Y)
    With myDocument.Shapes.AddLine(10, i, i, 200).Line
     .ForeColor.RGB = RGB(0, 0, 255)
    End With
i = i + 10
Wend

End Sub
 
Upvote 0
Hello JugglerJAF - I couldn't resist playing around now that you got me started. Take a look at the code below to draw the imaged figure. All the best.

VBA Code:
Sub PatternsWithLinesAll()
Set myDocument = Worksheets(1)
i = 0

While i < 200
'Green - Bottom Right
    With myDocument.Shapes.AddLine(200, 10 + i, 200 - i, 200).Line
     .ForeColor.RGB = RGB(0, 255, 0)
    End With
'Blue - Bottom Left
    With myDocument.Shapes.AddLine(10, i + 10, i + 10, 200).Line
     .ForeColor.RGB = RGB(0, 0, 255)
    End With
'Red - Top Right
    With myDocument.Shapes.AddLine(i + 10, 10, 200, i + 10).Line
     .ForeColor.RGB = RGB(255, 0, 0)
    End With
'Yellow - Top Left
    With myDocument.Shapes.AddLine(10, 10 + i, 200 - i, 10).Line
     .ForeColor.RGB = RGB(255, 255, 0)
    End With
'Wait 1 second
Application.Wait (Now + TimeValue("0:00:01"))
i = i + 10
Wend

End Sub
 

Attachments

  • LineDrawing.JPG
    LineDrawing.JPG
    53.8 KB · Views: 6
Upvote 0

Forum statistics

Threads
1,214,920
Messages
6,122,279
Members
449,075
Latest member
staticfluids

We've detected that you are using an adblocker.

We have a great community of people providing Excel help here, but the hosting costs are enormous. You can help keep this site running by allowing ads on MrExcel.com.
Allow Ads at MrExcel

Which adblocker are you using?

Disable AdBlock

Follow these easy steps to disable AdBlock

1)Click on the icon in the browser’s toolbar.
2)Click on the icon in the browser’s toolbar.
2)Click on the "Pause on this site" option.
Go back

Disable AdBlock Plus

Follow these easy steps to disable AdBlock Plus

1)Click on the icon in the browser’s toolbar.
2)Click on the toggle to disable it for "mrexcel.com".
Go back

Disable uBlock Origin

Follow these easy steps to disable uBlock Origin

1)Click on the icon in the browser’s toolbar.
2)Click on the "Power" button.
3)Click on the "Refresh" button.
Go back

Disable uBlock

Follow these easy steps to disable uBlock

1)Click on the icon in the browser’s toolbar.
2)Click on the "Power" button.
3)Click on the "Refresh" button.
Go back
Back
Top