Hello,
I don't have much experience with charts in excel and I'm not sure how to build this chart I want with my data set. Below is a sample of the data:
<colgroup><col><col><col><col><col></colgroup><tbody>
</tbody>
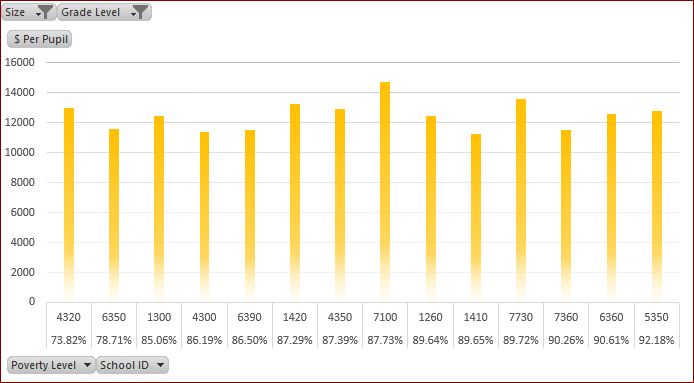
What I'm trying to do is make a cluster chart with the Poverty level on the X axis and the $ per pupil on the Y axis. Then plot each school on the graph, but have 6 distinct clusters (Elementary-small, Elementary-medium, Elementary-large, High School-small, High School-medium and High School-Large).
I can do it as just one big cluster, but do not know how to create the separate clusters.
Any thoughts on this would be greatly appreciated!
Thank you,
Ed
I don't have much experience with charts in excel and I'm not sure how to build this chart I want with my data set. Below is a sample of the data:
| School ID | Grade Level | Size | $ Per Pupil | Poverty Level |
| 2010 | High School | Medium | 13,679.74 | 82.31% |
| 7100 | Elementary School | Medium | 14,730.47 | 87.73% |
| 7730 | Elementary School | Medium | 13,561.13 | 89.72% |
| 4020 | High School | Medium | 12,323.29 | 76.69% |
| 4140 | High School | Small | 13,463.25 | 85.20% |
| 1260 | Elementary School | Medium | 12,483.32 | 89.64% |
| 6350 | Elementary School | Medium | 11,607.09 | 78.71% |
| 6360 | Elementary School | Medium | 12,554.60 | 90.61% |
| 7360 | Elementary School | Medium | 11,491.74 | 90.26% |
| 1300 | Elementary School | Medium | 12,475.01 | 85.06% |
| 6390 | Elementary School | Medium | 11,548.89 | 86.50% |
| 2000 | High School | Medium | 14,660.81 | 75.12% |
| 1100 | High School | Medium | 14,590.71 | 82.00% |
| 6060 | High School | Medium | 13,464.63 | 76.36% |
| 4350 | Elementary School | Medium | 12,954.86 | 87.39% |
| 4320 | Elementary School | Medium | 13,003.60 | 73.82% |
| 5350 | Elementary School | Medium | 12,761.92 | 92.18% |
| 5620 | High School | Small | 15,053.34 | 80.00% |
| 5610 | High School | Small | 13,822.31 | 82.49% |
| 4300 | Elementary School | Medium | 11,357.39 | 86.19% |
| 1460 | Elementary School | Medium | 13,305.63 | 81.93% |
| 7010 | High School | Large | 12,056.31 | 79.09% |
| 1410 | Elementary School | Medium | 11,239.46 | 89.65% |
| 1420 | Elementary School | Medium | 13,267.79 | 87.29% |
| 8010 | High School | Large | 12,559.10 | 69.40% |
| 7120 | High School | Large | 12,801.50 | 73.37% |
<colgroup><col><col><col><col><col></colgroup><tbody>
</tbody>
What I'm trying to do is make a cluster chart with the Poverty level on the X axis and the $ per pupil on the Y axis. Then plot each school on the graph, but have 6 distinct clusters (Elementary-small, Elementary-medium, Elementary-large, High School-small, High School-medium and High School-Large).
I can do it as just one big cluster, but do not know how to create the separate clusters.
Any thoughts on this would be greatly appreciated!
Thank you,
Ed