hip2b2
Board Regular
- Joined
- May 5, 2003
- Messages
- 135
- Office Version
- 2019
- Platform
- Windows
It's been a while since the last time I've done any charting in Excel 2019 and the problems I am having are mostly really basic.
Thanks in advance for any help
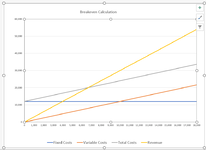
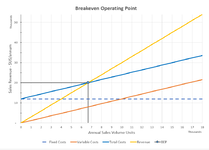
- I can't add axis titles, I know there must be a way to do so I just can't find it
- I am able to change the Y-axis scale, but is there a way to change the X-Axis scale without changing the data?
- There must be some way that I can calculate the intersection of "Revenue" and "Variable Costs" and show that on the chart as both a data point and vertical and horizontal lines???
| BEP2xlsm.xlsm | ||||||||
|---|---|---|---|---|---|---|---|---|
| A | B | C | D | E | F | |||
| 1 | Break Even Analysis | |||||||
| 2 | Sales Volume | 18,000 | Units | |||||
| 3 | Fixed Costs | 12,000 | $ | |||||
| 4 | Average Variable Costs | 1.2 | $ | |||||
| 5 | Unit Sales Price | 3 | $ | |||||
| 6 | Contribution Margin | 1.8 | $ | |||||
| 7 | BEP sales Volume | 6,667 | Units | |||||
| 8 | BEP | 20,000 | $ | |||||
| 9 | ||||||||
| 10 | ||||||||
| 11 | ||||||||
| 12 | ||||||||
| 13 | ||||||||
| 14 | Units/annum | Fixed Costs | Variable Costs | Total Costs | Revenue | |||
| 15 | 0 | 12,000 | 0 | 12,000 | 0 | |||
| 16 | 1,000 | 12,000 | 1,200 | 13,200 | 3,000 | the Fixed costs values are constant and equal to C3 (= $C$3), | ||
| 17 | 2,000 | 12,000 | 2,400 | 14,400 | 6,000 | the Variable costs values = Average variable costs * Units (= $C$4 * A11), | ||
| 18 | 3,000 | 12,000 | 3,600 | 15,600 | 9,000 | the Total costs values = Fixed costs + Variable costs (= B11 + C11), | ||
| 19 | 4,000 | 12,000 | 4,800 | 16,800 | 12,000 | the Revenue values = Unit sale price * Units (= $C$5 * A11). | ||
| 20 | 5,000 | 12,000 | 6,000 | 18,000 | 15,000 | |||
| 21 | 6,000 | 12,000 | 7,200 | 19,200 | 18,000 | |||
| 22 | 7,000 | 12,000 | 8,400 | 20,400 | 21,000 | |||
| 23 | 8,000 | 12,000 | 9,600 | 21,600 | 24,000 | |||
| 24 | 9,000 | 12,000 | 10,800 | 22,800 | 27,000 | |||
| 25 | 10,000 | 12,000 | 12,000 | 24,000 | 30,000 | |||
| 26 | 11,000 | 12,000 | 13,200 | 25,200 | 33,000 | |||
| 27 | 12,000 | 12,000 | 14,400 | 26,400 | 36,000 | |||
| 28 | 13,000 | 12,000 | 15,600 | 27,600 | 39,000 | |||
| 29 | 14,000 | 12,000 | 16,800 | 28,800 | 42,000 | |||
| 30 | 15,000 | 12,000 | 18,000 | 30,000 | 45,000 | |||
| 31 | 16,000 | 12,000 | 19,200 | 31,200 | 48,000 | |||
| 32 | 17,000 | 12,000 | 20,400 | 32,400 | 51,000 | |||
| 33 | 18,000 | 12,000 | 21,600 | 33,600 | 54,000 | |||
Data | ||||||||
| Cell Formulas | ||
|---|---|---|
| Range | Formula | |
| B6 | B6 | =B5-B4 |
| B7 | B7 | =ROUND(B3/B6,0) |
| B8 | B8 | =B3/((B5-B4)/B5) |
| B15:B33 | B15 | =$B$3 |
| D15:D33 | D15 | =B15+C15 |
| C16:C33 | C16 | =$B$4*A16 |
| E16:E33 | E16 | =$B$5*A16 |
Thanks in advance for any help