wdavis5917
New Member
- Joined
- Jan 21, 2020
- Messages
- 3
- Office Version
- 365
- 2019
- 2016
- 2013
- Platform
- Windows
New to excel but slowly and surely making progress. One of our divisions provides services to clients at a fixed fee. We projected that we would begin January 2020 with 25 clients, averaging $5k per month, per client, and projected we'd add 3 clients per month, each month whom would also average $5k each per month thereafter. I want to create a forecast that reflects the compounding effects of not adding 3 clients per month, or even losing a client, based on the month. I would then like to create a line(s) that shows what we have to do to correct it. For example, if we didn't add 3 clients in January, the compounding impact by the end of 2020 would be $180,000. That can be correct in three ways (1) add the clients as soon as possible, (2) Earn higher fees per client for the current client base, or (3) a combination of both these things.
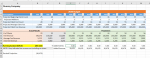
I have an image of my sheet attached, and you'll see I have a table that provides the assumptions for the 2020 budget. This includes beginning client count, projected client adds, @$5,000 per client, to arrive at ending projected fee revenue. Beneath it, we've completed January and February, and March I have input the secured clients we have at the beginning of the month. These are all in pink, but the area I have shaded grey is meant to indicate those months (Feb and March) will have additional revenue added to them for month-revenue share. Its likely around $40k at a client base of around 30 but my plan was to use the average fee revenue from January as my basis for the projection forward (April-Dec). Then, as each month officially closes, I'll use the most current months average fee revenue to project forward. You'll see I have a running surplus/deficit, which is just secured revenue (Jan-Mar), and projecting out through Dec the revised numbers that adds 3 clients to the ending March client count.
From there, I'm basically saying a have a $287k deficit that needs to be absorbed over the next 9 months assuming an average monthly client fee of $5,113. My formula is =FLOOR((-$B$17/E14)/$C$17,1) which gives me clients rounded to 6 where I multiply by the $5,206. This works to an extent but there is still a discrepancy no matter how I try to adjust the formula to calculate the clients needed. I wish it were a bit more dynamic in that I could play with the numbers by saying in addition to our regular 3 added each month, 2 were added in April, not in May-Jun, but 5 were added in Jul, and the average fee revenue is actually $5,700 per client per month, etc.
Is this possible?