Combination chart problem

Chris00000

New Member
Joined
Jul 2, 2021
Messages
4
Office Version
  1. 2016
Platform
  1. Windows
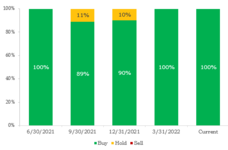
I'm trying to make a combination chart in which there are 3 series of stacked bar chart, with only 5 data points (dates). I want to add stock price history as a secondary axis, but given it has hundreds of data points, it pushes my first three series to the front of the chart and screws everything up. Does anyone know how to fix this?
 

Excel Facts

Links? Where??
If Excel says you have links but you can't find them, go to Formulas, Name Manager. Look for old links to dead workbooks & delete.
It would be easier to answer this if we could see some data, but...

Click the plus sign next to the chart, click on the triangle next to Axes, then check Secondary Horizontal. Then you'll probably have to tweak both sets of axes.
 
Upvote 0
See attached. So, I have 5 data points. If I wanted to overlay the daily stock prices over this period, is there a way to do that on the secondary axis?
 

Attachments

  • 52622.png
    52622.png
    7.5 KB · Views: 7
Upvote 0
Okay, here's your data. Five quarterly values in one block for a column chart, and 229 daily values from 6/30/2021 to yesterday for a line chart.

ComboQuarterlyDailyData.png


The evolution of the combination chart is shown below.

You want to combine the column chart and line chart in the top row.

Starting with the Quarterly chart, copy the daily data, select the chart, and use Paste Special to add the copied data to the Quarterly chart as a new series, with series name in the first row and category (X-axis) values in the first column, but don't overwrite existing categories. This results in Combo Chart 1.

Right-click on the new series, and choose Change Series Chart Type from the menu. Change the series to a line on the secondary axis (Combo Chart 2).

Click on the plus icon beside the chart, click the triangle next to Axes, and check the secondary horizontal axis (Combo Chart 3).

Change the secondary axis scale to line it up with the primary scale. You need half a quarter before 6/30/2021 and half a quarter after 6/30/2022, so the minimum has to be 5/15/2021 and the maximum 8/15/2022 (Combo Chart 4).

Finally, clean it up. Format the secondary horizontal axis, format the axis label position to no labels, and format the major tick mark type to none (Combo Chart 5).

ComboQuarterlyDailyCharts.png
 
Upvote 0
Solution
I'll try this tomorrow, but looks like you got it. You are the man, Jon.
 
Upvote 0

Forum statistics

Threads
1,214,978
Messages
6,122,545
Members
449,089
Latest member
davidcom

We've detected that you are using an adblocker.

We have a great community of people providing Excel help here, but the hosting costs are enormous. You can help keep this site running by allowing ads on MrExcel.com.
Allow Ads at MrExcel

Which adblocker are you using?

Disable AdBlock

Follow these easy steps to disable AdBlock

1)Click on the icon in the browser’s toolbar.
2)Click on the icon in the browser’s toolbar.
2)Click on the "Pause on this site" option.
Go back

Disable AdBlock Plus

Follow these easy steps to disable AdBlock Plus

1)Click on the icon in the browser’s toolbar.
2)Click on the toggle to disable it for "mrexcel.com".
Go back

Disable uBlock Origin

Follow these easy steps to disable uBlock Origin

1)Click on the icon in the browser’s toolbar.
2)Click on the "Power" button.
3)Click on the "Refresh" button.
Go back

Disable uBlock

Follow these easy steps to disable uBlock

1)Click on the icon in the browser’s toolbar.
2)Click on the "Power" button.
3)Click on the "Refresh" button.
Go back
Back
Top