Combine filters and do a summary table based on filtering

Shukis7

New Member
Joined
Dec 14, 2021
Messages
22
Office Version
  1. 365
Platform
  1. Windows
Hi,

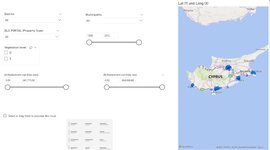
On the report view I have created some basic drop down lists. Whenever I choose a district and then a municipality I would like to have a summary table on the bottom of the page (please see attached) which will count how many observations I have for the specific district, municipality. I want it to be interactive based on the choice of the drop down list above.

Thank you for the help and I can explain better if you don't understand!

I appreciate the help.
 

Attachments

  • Screenshot 2022-05-02 172704.jpg
    Screenshot 2022-05-02 172704.jpg
    78.8 KB · Views: 5

Excel Facts

Links? Where??
If Excel says you have links but you can't find them, go to Formulas, Name Manager. Look for old links to dead workbooks & delete.

Forum statistics

Threads
1,214,925
Messages
6,122,298
Members
449,077
Latest member
Rkmenon

We've detected that you are using an adblocker.

We have a great community of people providing Excel help here, but the hosting costs are enormous. You can help keep this site running by allowing ads on MrExcel.com.
Allow Ads at MrExcel

Which adblocker are you using?

Disable AdBlock

Follow these easy steps to disable AdBlock

1)Click on the icon in the browser’s toolbar.
2)Click on the icon in the browser’s toolbar.
2)Click on the "Pause on this site" option.
Go back

Disable AdBlock Plus

Follow these easy steps to disable AdBlock Plus

1)Click on the icon in the browser’s toolbar.
2)Click on the toggle to disable it for "mrexcel.com".
Go back

Disable uBlock Origin

Follow these easy steps to disable uBlock Origin

1)Click on the icon in the browser’s toolbar.
2)Click on the "Power" button.
3)Click on the "Refresh" button.
Go back

Disable uBlock

Follow these easy steps to disable uBlock

1)Click on the icon in the browser’s toolbar.
2)Click on the "Power" button.
3)Click on the "Refresh" button.
Go back
Back
Top