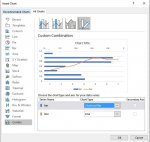
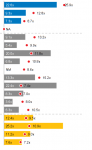
Hi, I believe that in Excel 2003 you could make a combination chart with a bar chart (axis is vertical, and the bars are horizontal) and a line chart (the line is vertical). But now in the newer Excel version I'm using (2016? Office365?) you can only do a combo chart when it's a column chart. Does anybody know how to do what I'm looking to do with the bar chart?
Thanks!
Thanks!