ComboBox and Showing Graphs

tronter32

New Member
Joined
Jan 16, 2014
Messages
1
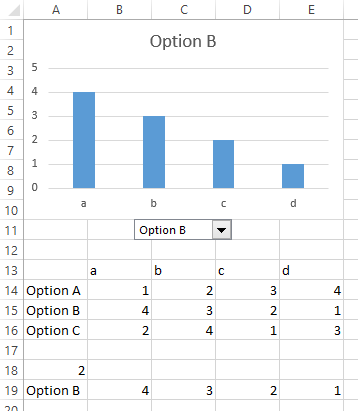
I have a list of items. I want to use a ComboBox to choose an item and show the graphs associated with that item. This code uses a drop-down box:

Code:
Private Sub Worksheet_SelectionChange(ByVal Target As Range)

If Target.Address = "$C$1" Then
        ActiveSheet.ChartObjects.Visible = False
       On Error Resume Next
       ChartObjects(Target.Value).Visible = True
End If
End Sub


But you have to click another cell and then click back on the original cell for the graph to change. Would the ComboBox code be the same? Would I just change it to
Code:
 Private Sub ComboBox1_Click()
? Also Would I need to put every graph on the sheet? If I choose an item from the combo box, wouldn't that only show one graph with that name instead of all graphs with that name?
 

Excel Facts

Convert text numbers to real numbers
Select a column containing text numbers. Press Alt+D E F to quickly convert text to numbers. Faster than "Convert to Number"
Hello and welcome to the Board

o I’m assuming the combo box goes on the sheet, not on a user form.
o Do you want to fill the combo box with chart names?
o Do you have charts with the same name on the worksheet? If so, selecting that name will only show one of them. Would you like to show them all?
o Below is some example code,”AllCharts” will display a list of the charts on that sheet.

Code:
Private Sub ComboBox1_Change()
ActiveSheet.ChartObjects.Visible = False
On Error Resume Next
ChartObjects(Me.ComboBox1.Value).Visible = True


End Sub


Sub AllCharts()
Dim ch As ChartObject, ast$
ast = ""
For Each ch In ActiveSheet.ChartObjects
    ast = ast & ch.Index & "  " & ch.Name & vbLf
Next
MsgBox ast, vbInformation


End Sub
 
Upvote 0
If you're after a non-VBA way, you can make a dynamic table using Vlookup and data -validation. For example, in cell B5, there is data validation, this is used for the Vlookup for your dynamic table, so when you select different options in B5, the table updates. This table will be used to create your chart. For titles, I use a text box and link the text box to B5, so the title is updated as well. Hope this helps
 
Upvote 0
Would it be enough to simply change which data series is plotted in a single chart? Here's a non-VBA approach.

InteractiveColumnChart.png


The dropdown is from the Forms Menu group (not ActiveX). The list source is A14:A16 (the option names) and the link cell is A18. The formula in A19 and filled out to E19 is

=INDEX(A14:A16,$A18)

so that row 19 changes when the dropdown is changed. The chart uses B13:E13 as its X values, B19:E19 as its Y values, and A19 as the series name. This way, changing the dropdown, which changes row 19, also changes the chart.
 
Upvote 0

Forum statistics

Threads
1,214,606
Messages
6,120,490
Members
448,967
Latest member
visheshkotha

We've detected that you are using an adblocker.

We have a great community of people providing Excel help here, but the hosting costs are enormous. You can help keep this site running by allowing ads on MrExcel.com.
Allow Ads at MrExcel

Which adblocker are you using?

Disable AdBlock

Follow these easy steps to disable AdBlock

1)Click on the icon in the browser’s toolbar.
2)Click on the icon in the browser’s toolbar.
2)Click on the "Pause on this site" option.
Go back

Disable AdBlock Plus

Follow these easy steps to disable AdBlock Plus

1)Click on the icon in the browser’s toolbar.
2)Click on the toggle to disable it for "mrexcel.com".
Go back

Disable uBlock Origin

Follow these easy steps to disable uBlock Origin

1)Click on the icon in the browser’s toolbar.
2)Click on the "Power" button.
3)Click on the "Refresh" button.
Go back

Disable uBlock

Follow these easy steps to disable uBlock

1)Click on the icon in the browser’s toolbar.
2)Click on the "Power" button.
3)Click on the "Refresh" button.
Go back
Back
Top