mathay2603
New Member
- Joined
- May 4, 2023
- Messages
- 3
- Office Version
- 365
- Platform
- Windows
Hi everyone,
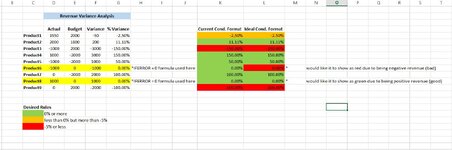
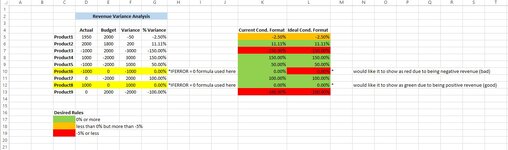
I am currently conducting some revenue variance analysis and I'm having a nightmare coming up with a conditional formatting formula that works for each of the 9 lines.
Please see image attached.
Column K, is how I'd ideally like the % revenue variance conditionally formatted. Where it gets particularly tricky is for product 6 and 8.
Product 6 is where I have negative revenue (bad) vs a budget of 0. Now obviously % variance is technically -infinity% but I would like it to show as 0% but have a conditional format of red 0%. But then you have product 8 that has positive revenue of 1000 vs a budget of 0, which is technically infinity% but I would like to show it as 0% but green.
I have written formula (detailed below) that works for every line apart from these two. Does anyone know how I could achieve the above please? Its driving me insane!
In order of priority:
Green = IFERROR(IF(E5<0,(D5-E5)/-E5,(D5-E5)/E5),0)>=0%
Red=(IF(E5<0,(D5-E5)/-E5,(D5-E5)/E5),0)<-5%
Amber =(IF(E5<0,(D5-E5)/-E5,(D5-E5)/E5),0)>-5%
Many thanks!!