Copy formula but change cells Gantt chart

onegun15

New Member
Joined
Jan 31, 2022
Messages
5
Office Version
  1. 365
  2. 2011
Platform
  1. Windows
Hey all,

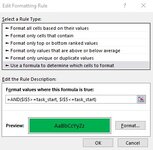
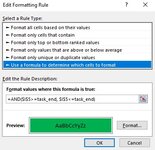
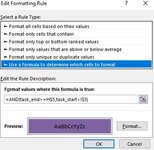
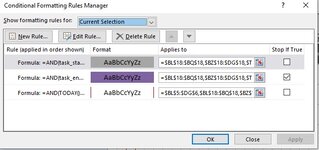
I am new here but have been on a journey getting better with excel. I have an issue with my Gantt chart which I tailored from the basic Gantt template in excel. Essentially right now when I enter start and end date it generate a bar that goes through that entire time on my timeline to the right of it. However, I am trying to add a formula where it also highlights the start date and end date block a different color specifically. Currently the formula I input which works is [D5 will be example correlating the date on the timeline in that column] =AND(D5>=task_start, D5<=task_start) I also put in =AND(D5>=task_end, D5<=task_end). This works and if I use formula painted down the entire column it’s fine but the problem is I would need to do this for months of data. Is there a way to copy this formula and have the reference cell change dynamically with it? Is this something I need to do with a VBA formula and if so any help would be appreciated.

Thanks,
Nick
 

Excel Facts

How to find 2nd largest value in a column?
MAX finds the largest value. =LARGE(A:A,2) will find the second largest. =SMALL(A:A,3) will find the third smallest
Your description is not meaningful without also having the file. Also, is the formula you are showing a Conditional Formatting condition formula?

I am going to take my best guess, but this is based on what I think you are asking and what I think your file looks like. There are many Gantt templates so "the basic Gantt template" doesn't pinpoint it. Can you provide it on a file sharing service, or tell us exactly how to get to it in Excel?

A conditional formatting formula applies to the entire range but the formula is written as though it applied to the upper-left cell of that range. The cell references are automatically updated by Excel for each cell in the Applies To range. You simply need to take this rule and change the Applies To range from

$D:$D

to

$D:$Z

or whatever your desired range is. Also you need to make the row reference absolute so it will work for all rows, assuming your dates are in row 5.

Excel Formula:
=AND(D$5>=task_start, D$5<=task_start)

How is task_start defined?
 
Upvote 0
Your description is not meaningful without also having the file. Also, is the formula you are showing a Conditional Formatting condition formula?

I am going to take my best guess, but this is based on what I think you are asking and what I think your file looks like. There are many Gantt templates so "the basic Gantt template" doesn't pinpoint it. Can you provide it on a file sharing service, or tell us exactly how to get to it in Excel?

A conditional formatting formula applies to the entire range but the formula is written as though it applied to the upper-left cell of that range. The cell references are automatically updated by Excel for each cell in the Applies To range. You simply need to take this rule and change the Applies To range from

$D:$D

to

$D:$Z

or whatever your desired range is. Also you need to make the row reference absolute so it will work for all rows, assuming your dates are in row 5.

Excel Formula:
=AND(D$5>=task_start, D$5<=task_start)

How is task_start defined?
okay, sorry about that. Here is the link to the basic gantt template I used. Simple Gantt Chart Template Site Additionally, I have attached some screenshots to help show what I am talking about because I cannot get the mini sheet button in the Xl2bb add on to be clickable. Like I mentioned before my rules seem to work but I need to write it separately for each column and then format paint it down and there are a lot of columns. Looking for more efficient way to do this.
 

Attachments

  • rule I created for start date color.jpg
    rule I created for start date color.jpg
    42.3 KB · Views: 12
  • rule I created for end date color.jpg
    rule I created for end date color.jpg
    41.6 KB · Views: 11
  • rule that covers entire time period color.jpg
    rule that covers entire time period color.jpg
    41.7 KB · Views: 12
  • conditional format rules manager from template screenshot.jpg
    conditional format rules manager from template screenshot.jpg
    48.1 KB · Views: 12
Upvote 0
okay, sorry about that. Here is the link to the basic gantt template I used. Simple Gantt Chart Template Site Additionally, I have attached some screenshots to help show what I am talking about because I cannot get the mini sheet button in the Xl2bb add on to be clickable. Like I mentioned before my rules seem to work but I need to write it separately for each column and then format paint it down and there are a lot of columns. Looking for more efficient way to do this.
Realized I did not answer your question of how task_start and task_end are defined. See attached screenshot.

Thanks for the help
 

Attachments

  • definition screenshot.jpg
    definition screenshot.jpg
    75.1 KB · Views: 11
Upvote 0
I'm not really following this. The Applies To ranges are disjoint and I don't know how that applies to your file.

I downloaded the template. We need to start from there rather than trying to patch up anything you have done. Starting from the template, I take it you basically want to use conditional formatting to highlight the start date of each task one color, and the end date of each task another color. Do I understand that correctly? Here is my starting point:

gantt.JPG
 
Upvote 0
I'm not really following this. The Applies To ranges are disjoint and I don't know how that applies to your file.

I downloaded the template. We need to start from there rather than trying to patch up anything you have done. Starting from the template, I take it you basically want to use conditional formatting to highlight the start date of each task one color, and the end date of each task another color. Do I understand that correctly? Here is my starting point:

View attachment 56688
Yes, you are correct. I want the start date to be one color and the end date another. If it is easier though I am okay with start and end date being the same color. I still need the bar to display the entire time period though as well with a color like it currently does. I am not really concerned about the progress bar.

Essentially, even though a Gantt is typically for displaying progress of a project I am utilizing it to track and display travel of personnel. So in my case I am trying to display the day they fly out to their destination, the time period they are in their destination and the day they return.

-Nick
 
Upvote 0
Yeah, that's why I wanted to start over. I think you were getting tangled up. Good luck!
 
Upvote 0

Forum statistics

Threads
1,214,918
Messages
6,122,241
Members
449,075
Latest member
staticfluids

We've detected that you are using an adblocker.

We have a great community of people providing Excel help here, but the hosting costs are enormous. You can help keep this site running by allowing ads on MrExcel.com.
Allow Ads at MrExcel

Which adblocker are you using?

Disable AdBlock

Follow these easy steps to disable AdBlock

1)Click on the icon in the browser’s toolbar.
2)Click on the icon in the browser’s toolbar.
2)Click on the "Pause on this site" option.
Go back

Disable AdBlock Plus

Follow these easy steps to disable AdBlock Plus

1)Click on the icon in the browser’s toolbar.
2)Click on the toggle to disable it for "mrexcel.com".
Go back

Disable uBlock Origin

Follow these easy steps to disable uBlock Origin

1)Click on the icon in the browser’s toolbar.
2)Click on the "Power" button.
3)Click on the "Refresh" button.
Go back

Disable uBlock

Follow these easy steps to disable uBlock

1)Click on the icon in the browser’s toolbar.
2)Click on the "Power" button.
3)Click on the "Refresh" button.
Go back
Back
Top