Count and order (from A-Z) number of recurring text strings

zgoldflo

New Member
Joined
Dec 13, 2021
Messages
30
Office Version
  1. 365
Platform
  1. Windows
Hi folks.

Working with a (trimmed) dataset with over 25,000 rows of data.

Objective: Determine the top 100 most common route_taken for each user_type (only two user_type i.e. casual & member).
Details: Over 6,980 number_unique_routes.

Explanation: Trying to figure out either by using a pivot_table (tried but really don't know how to input data correctly) or by using a function/formula how to retrieve the most common routes taken for members and casual users. Would like to first understand how to apply the formula/function to retrieve the most common routes how many times they appear ordered by Z-A (to retrieve the top 100 rows of data). Not sure how to implement the =COUNTIF function in this scenario to count recurring text strings and how I can apply it. An explanation would really wrap my mind around it, thanks in advance (@Joe4 any ideas?).

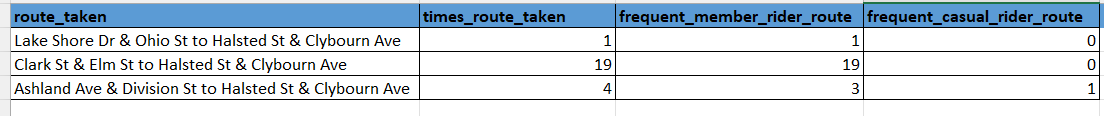
e.g. something like this maybe? (open to suggestions on better ways to structure this)
*Note
with some route_taken you might get an instance where both members and casual riders use that route but members or casual riders could be the more common user. (See frequent_rider_route columns)

1639539967859.png


I think I made my problem quite clear - if any clarification is needed, please let me know!

See below MiniSheet


December_2020_trimmed_v2.csv
ABCDEFGHIJKLMNO
1ride_iduser_typerideable_typeday_of_weekstarted_atended_atride_lengthstart_station_nameend_station_nameroute_takenstart_station_idend_station_idstart_coordinatesend_coordinatesdistance_traveled_miles
28AC7643FDA05E1D4memberclassic_bike32020-12-08T05:41:00Z2020-12-08T06:21:00Z0:40:05Larrabee St & North AveHalsted St & Clybourn AveLarrabee St & North Ave to Halsted St & Clybourn AveTA130600000833141.91021, -87.643541.909668, -87.6481280.24089942
322B721668F54DF09memberclassic_bike42020-12-09T05:55:00Z2020-12-09T06:17:00Z0:21:56Larrabee St & North AveHalsted St & Clybourn AveLarrabee St & North Ave to Halsted St & Clybourn AveTA130600000833141.91021, -87.643541.909668, -87.6481280.24089942
40AE1B9DB2F1F8BC2memberclassic_bike12020-12-13T12:00:00Z2020-12-13T12:03:00Z0:03:03Larrabee St & North AveHalsted St & Clybourn AveLarrabee St & North Ave to Halsted St & Clybourn AveTA130600000833141.91021, -87.643541.909668, -87.6481280.24089942
58DAEDE1893BCCBC8memberclassic_bike62020-12-18T11:57:00Z2020-12-18T12:00:00Z0:03:00Larrabee St & North AveHalsted St & Clybourn AveLarrabee St & North Ave to Halsted St & Clybourn AveTA130600000833141.91021, -87.643541.909668, -87.6481280.24089942
6EEC33E416B277B7Acasualclassic_bike12020-12-20T18:47:00Z2020-12-20T19:00:00Z0:13:05Larrabee St & North AveHalsted St & Clybourn AveLarrabee St & North Ave to Halsted St & Clybourn AveTA130600000833141.91021, -87.643541.909668, -87.6481280.24089942
795B7ADC081755772casualclassic_bike42020-12-09T14:58:00Z2020-12-09T15:08:00Z0:10:36Greenview Ave & Fullerton AveHalsted St & Clybourn AveGreenview Ave & Fullerton Ave to Halsted St & Clybourn AveTA130700000133141.92533, -87.665841.909668, -87.6481281.413006342
839CD27FB31626CD0memberclassic_bike52020-12-10T11:18:00Z2020-12-10T11:30:00Z0:11:19Greenview Ave & Fullerton AveHalsted St & Clybourn AveGreenview Ave & Fullerton Ave to Halsted St & Clybourn AveTA130700000133141.92533, -87.665841.909668, -87.6481281.413006342
95F82004CA928515Ememberclassic_bike62020-12-04T17:25:00Z2020-12-04T17:51:00Z0:25:40Halsted St & 21st StHalsted St & Clybourn AveHalsted St & 21st St to Halsted St & Clybourn Ave1316233141.85378, -87.6466541.909668, -87.6481283.862298702
1063A630ACCB226FB9memberdocked_bike32020-12-01T16:47:00Z2020-12-01T17:01:00Z0:13:40Clinton St & Washington BlvdHalsted St & Clybourn AveClinton St & Washington Blvd to Halsted St & Clybourn AveWL-01233141.88338, -87.6411741.909668, -87.6481281.851270921
11E17C812526F9D612memberclassic_bike42020-12-16T19:26:00Z2020-12-16T19:41:00Z0:14:22Franklin St & Lake StHalsted St & Clybourn AveFranklin St & Lake St to Halsted St & Clybourn AveTA130700011133141.885837, -87.635541.909668, -87.6481281.770041463
1204B9C42C9716C149memberclassic_bike62020-12-11T11:18:00Z2020-12-11T11:27:00Z0:09:12Clark St & Chicago AveHalsted St & Clybourn AveClark St & Chicago Ave to Halsted St & Clybourn Ave1330333141.89675, -87.6308941.909668, -87.6481281.257971375
133F7080AE9A112A65memberclassic_bike22020-12-21T13:48:00Z2020-12-21T13:59:00Z0:10:08Clark St & Chicago AveHalsted St & Clybourn AveClark St & Chicago Ave to Halsted St & Clybourn Ave1330333141.89675, -87.6308941.909668, -87.6481281.257971375
14DFF386148F369DFFcasualdocked_bike62020-12-04T16:48:00Z2020-12-04T17:17:00Z0:28:52Michigan Ave & Pearson StHalsted St & Clybourn AveMichigan Ave & Pearson St to Halsted St & Clybourn Ave1303433141.89766, -87.6235141.909668, -87.6481281.513630094
156C6D711A027111B2casualdocked_bike62020-12-04T16:48:00Z2020-12-04T17:17:00Z0:28:21Michigan Ave & Pearson StHalsted St & Clybourn AveMichigan Ave & Pearson St to Halsted St & Clybourn Ave1303433141.89766, -87.6235141.909668, -87.6481281.513630094
16E91724E781837DD6memberclassic_bike12020-12-27T13:51:00Z2020-12-27T14:04:00Z0:13:44Michigan Ave & Pearson StHalsted St & Clybourn AveMichigan Ave & Pearson St to Halsted St & Clybourn Ave1303433141.89766, -87.6235141.909668, -87.6481281.513630094
17F4299DE0DFDDFD36memberclassic_bike12020-12-27T14:41:00Z2020-12-27T15:05:00Z0:24:50Michigan Ave & Pearson StHalsted St & Clybourn AveMichigan Ave & Pearson St to Halsted St & Clybourn Ave1303433141.89766, -87.6235141.909668, -87.6481281.513630094
180512A33336892105memberclassic_bike62020-12-04T13:04:00Z2020-12-04T13:14:00Z0:09:58Ashland Ave & Augusta BlvdHalsted St & Clybourn AveAshland Ave & Augusta Blvd to Halsted St & Clybourn Ave1324833141.899643, -87.667741.909668, -87.6481281.221793274
19D3C1914BB8301A7Fmemberclassic_bike12020-12-13T17:29:00Z2020-12-13T17:34:00Z0:05:04Larrabee St & Menomonee StHalsted St & Clybourn AveLarrabee St & Menomonee St to Halsted St & Clybourn AveTA130600000733141.91468, -87.6433241.909668, -87.6481280.425489373
209F21F589917D69CCcasualclassic_bike12020-12-06T12:12:00Z2020-12-06T13:15:00Z1:02:14Clark St & Lincoln AveHalsted St & Clybourn AveClark St & Lincoln Ave to Halsted St & Clybourn Ave1317933141.915689, -87.634641.909668, -87.6481280.810492488
21BCC1E5EEDBB31529casualclassic_bike12020-12-06T12:12:00Z2020-12-06T13:15:00Z1:02:04Clark St & Lincoln AveHalsted St & Clybourn AveClark St & Lincoln Ave to Halsted St & Clybourn Ave1317933141.915689, -87.634641.909668, -87.6481280.810492488
22AFE6DE4D8061D6F5memberclassic_bike12020-12-06T14:54:00Z2020-12-06T15:04:00Z0:09:10Clark St & Lincoln AveHalsted St & Clybourn AveClark St & Lincoln Ave to Halsted St & Clybourn Ave1317933141.915689, -87.634641.909668, -87.6481280.810492488
23CAAABC0E9EA76453memberclassic_bike12020-12-06T15:48:00Z2020-12-06T15:57:00Z0:08:57Clark St & Lincoln AveHalsted St & Clybourn AveClark St & Lincoln Ave to Halsted St & Clybourn Ave1317933141.915689, -87.634641.909668, -87.6481280.810492488
24EB83EB7EC542A6FBmemberclassic_bike52020-12-10T09:43:00Z2020-12-10T09:53:00Z0:09:40Clark St & Lincoln AveHalsted St & Clybourn AveClark St & Lincoln Ave to Halsted St & Clybourn Ave1317933141.915689, -87.634641.909668, -87.6481280.810492488
255B9A60CCDD6A98C0memberclassic_bike72020-12-12T19:25:00Z2020-12-12T19:32:00Z0:06:46Clark St & Lincoln AveHalsted St & Clybourn AveClark St & Lincoln Ave to Halsted St & Clybourn Ave1317933141.915689, -87.634641.909668, -87.6481280.810492488
2682B443DA84AA3BEEmemberclassic_bike22020-12-14T14:55:00Z2020-12-14T15:03:00Z0:08:14Clark St & Lincoln AveHalsted St & Clybourn AveClark St & Lincoln Ave to Halsted St & Clybourn Ave1317933141.915689, -87.634641.909668, -87.6481280.810492488
275C13C2A9F537FAF4memberclassic_bike22020-12-14T15:43:00Z2020-12-14T15:53:00Z0:09:19Clark St & Lincoln AveHalsted St & Clybourn AveClark St & Lincoln Ave to Halsted St & Clybourn Ave1317933141.915689, -87.634641.909668, -87.6481280.810492488
2806C887C108F035ABmemberclassic_bike12020-12-27T14:02:00Z2020-12-27T14:14:00Z0:11:30Clark St & Lincoln AveHalsted St & Clybourn AveClark St & Lincoln Ave to Halsted St & Clybourn Ave1317933141.915689, -87.634641.909668, -87.6481280.810492488
29D084CF51C605C6F1memberclassic_bike32020-12-29T10:28:00Z2020-12-29T10:39:00Z0:10:44Clark St & Lincoln AveHalsted St & Clybourn AveClark St & Lincoln Ave to Halsted St & Clybourn Ave1317933141.915689, -87.634641.909668, -87.6481280.810492488
3003926929025B28C4casualclassic_bike32020-12-29T10:29:00Z2020-12-29T10:39:00Z0:10:30Clark St & Lincoln AveHalsted St & Clybourn AveClark St & Lincoln Ave to Halsted St & Clybourn Ave1317933141.915689, -87.634641.909668, -87.6481280.810492488
31E0D35323A3F37120memberclassic_bike42020-12-30T14:30:00Z2020-12-30T14:41:00Z0:11:36Clark St & Lincoln AveHalsted St & Clybourn AveClark St & Lincoln Ave to Halsted St & Clybourn Ave1317933141.915689, -87.634641.909668, -87.6481280.810492488
32B31E1E6AE33A971Acasualclassic_bike62020-12-04T11:04:00Z2020-12-04T11:10:00Z0:05:54Bissell St & Armitage AveHalsted St & Clybourn AveBissell St & Armitage Ave to Halsted St & Clybourn Ave1305933141.91844, -87.6522241.909668, -87.6481280.641575778
3329A5EF9EB208696Cmemberclassic_bike72020-12-19T16:23:00Z2020-12-19T16:37:00Z0:13:53Wilton Ave & Belmont AveHalsted St & Clybourn AveWilton Ave & Belmont Ave to Halsted St & Clybourn AveTA130700013433141.94018, -87.6530441.909668, -87.6481282.123278511
3424D4230E15AB999Cmemberclassic_bike42020-12-23T17:32:00Z2020-12-23T17:48:00Z0:16:13Wilton Ave & Belmont AveHalsted St & Clybourn AveWilton Ave & Belmont Ave to Halsted St & Clybourn AveTA130700013433141.94018, -87.6530441.909668, -87.6481282.123278511
35B487D55039F024CCmemberclassic_bike72020-12-05T14:14:00Z2020-12-05T14:33:00Z0:19:13Halsted St & Roscoe StHalsted St & Clybourn AveHalsted St & Roscoe St to Halsted St & Clybourn AveTA130900002533141.94367, -87.6489541.909668, -87.6481282.34972925
3616B7FFA064B5D6E7memberclassic_bike52020-12-10T23:47:00Z2020-12-11T00:11:00Z0:23:15Southport Ave & Waveland AveHalsted St & Clybourn AveSouthport Ave & Waveland Ave to Halsted St & Clybourn Ave1323533141.94815, -87.6639441.909668, -87.6481282.780353473
37F132B0A5A3A8E618memberclassic_bike72020-12-05T08:59:00Z2020-12-05T09:28:00Z0:28:39Michigan Ave & 18th StHalsted St & Clybourn AveMichigan Ave & 18th St to Halsted St & Clybourn Ave1315033141.857813, -87.6245541.909668, -87.6481283.782615327
38F8A1B3A64886E6DEmemberclassic_bike52020-12-17T09:09:00Z2020-12-17T09:41:00Z0:32:26Michigan Ave & 18th StHalsted St & Clybourn AveMichigan Ave & 18th St to Halsted St & Clybourn Ave1315033141.857813, -87.6245541.909668, -87.6481283.782615327
392BB5A5176858AF4Fmemberclassic_bike62020-12-04T15:35:00Z2020-12-04T16:01:00Z0:25:40Morgan St & Polk StHalsted St & Clybourn AveMorgan St & Polk St to Halsted St & Clybourn AveTA130700013033141.871737, -87.6510341.909668, -87.6481282.625068488
40F7BC88663BD0E589memberclassic_bike72020-12-05T11:22:00Z2020-12-05T11:39:00Z0:16:59Green St & Randolph StHalsted St & Clybourn AveGreen St & Randolph St to Halsted St & Clybourn Ave1305333141.883668, -87.6486741.909668, -87.6481281.796671786
41F2434FA3DA7E375Bmemberclassic_bike22020-12-21T15:48:00Z2020-12-21T15:58:00Z0:10:12Green St & Randolph StHalsted St & Clybourn AveGreen St & Randolph St to Halsted St & Clybourn Ave1305333141.883668, -87.6486741.909668, -87.6481281.796671786
42B9B5896F3987E87Cmemberdocked_bike42020-12-02T19:14:00Z2020-12-02T19:24:00Z0:10:12Orleans St & Merchandise Mart PlazaHalsted St & Clybourn AveOrleans St & Merchandise Mart Plaza to Halsted St & Clybourn AveTA130500002233141.888243, -87.6363941.909668, -87.6481281.598702019
4348317544FE71CA3Dcasualdocked_bike52020-12-03T05:24:00Z2020-12-03T05:36:00Z0:11:45Orleans St & Merchandise Mart PlazaHalsted St & Clybourn AveOrleans St & Merchandise Mart Plaza to Halsted St & Clybourn AveTA130500002233141.888243, -87.6363941.909668, -87.6481281.598702019
449E880C15C20F4C0Ememberclassic_bike72020-12-05T07:47:00Z2020-12-05T08:03:00Z0:15:11Orleans St & Merchandise Mart PlazaHalsted St & Clybourn AveOrleans St & Merchandise Mart Plaza to Halsted St & Clybourn AveTA130500002233141.888243, -87.6363941.909668, -87.6481281.598702019
453946CF247E7412D8memberclassic_bike12020-12-06T09:43:00Z2020-12-06T09:57:00Z0:14:09Orleans St & Merchandise Mart PlazaHalsted St & Clybourn AveOrleans St & Merchandise Mart Plaza to Halsted St & Clybourn AveTA130500002233141.888243, -87.6363941.909668, -87.6481281.598702019
465762DE06DBBF5E56memberclassic_bike52020-12-17T17:24:00Z2020-12-17T17:36:00Z0:11:48Orleans St & Merchandise Mart PlazaHalsted St & Clybourn AveOrleans St & Merchandise Mart Plaza to Halsted St & Clybourn AveTA130500002233141.888243, -87.6363941.909668, -87.6481281.598702019
47480DD48DCE8F8F07memberclassic_bike22020-12-28T15:13:00Z2020-12-28T15:22:00Z0:09:13Orleans St & Merchandise Mart PlazaHalsted St & Clybourn AveOrleans St & Merchandise Mart Plaza to Halsted St & Clybourn AveTA130500002233141.888243, -87.6363941.909668, -87.6481281.598702019
48B044F542D7E52FF5memberclassic_bike42020-12-23T13:18:00Z2020-12-23T13:37:00Z0:19:16Lake Shore Dr & Ohio StHalsted St & Clybourn AveLake Shore Dr & Ohio St to Halsted St & Clybourn AveTA130600002933141.89257, -87.61449241.909668, -87.6481282.094717503
49D000F7DF98EB762Cmemberclassic_bike52020-12-31T17:21:00Z2020-12-31T17:38:00Z0:17:25Lake Shore Dr & Ohio StHalsted St & Clybourn AveLake Shore Dr & Ohio St to Halsted St & Clybourn AveTA130600002933141.89257, -87.61449241.909668, -87.6481282.094717503
503BDEE3EFF60A7715casualclassic_bike22020-12-21T12:24:00Z2020-12-21T12:44:00Z0:20:29Damen Ave & Chicago AveHalsted St & Clybourn AveDamen Ave & Chicago Ave to Halsted St & Clybourn Ave1313233141.895769, -87.6772241.909668, -87.6481281.777778451
December_2020_trimmed_v2
Cell Formulas
RangeFormula
J2:J50J2=CONCAT(H2," to ", I2)
 

Attachments

  • 1639539472227.png
    1639539472227.png
    10 KB · Views: 7
Good to see the values are working now, I can't specifically answer the Michigan Ave query as I only have a snippet of your sample data.

The following will probably be close to what you need and I added avg time vs classic & docked, you can filter by route & user type;
  • Filters - route then user_type
  • Rows - rideable_type
  • Values - rideable_type (becomes Count of rideable type) then ride_length_convert (becomes Average of ride_length_convert)
Count and order (from A-Z) number of recurring text strings_zgoldflo.xlsx
ABCD
1
2route_taken(All)
3user_type(All)
4
5Row LabelsCount of rideable_typeAverage of ride_length
6classic_bike4400:16:45
7docked_bike500:18:34
8Grand Total4900:16:56
9
Route Analysis
 
Upvote 0

Excel Facts

Get help while writing formula
Click the italics "fx" icon to the left of the formula bar to open the Functions Arguments dialog. Help is displayed for each argument.
Hi @RasGhul.

I might have forgotten to mention a key nugget of information regarding this specific pivot table/filter. I only want to sort the bike_type information from the top 10 routes_taken by either classic/member users. Here is the pivot table that is now filtered to display the top 10 routes_taken among casual users. I could also toggle members to see their top 10 routes.

December_2020_trimmed.12.17.21.xlsx
ABCDEF
2Pivot Table 'Frequented Routes'
3Most frequented routes & stations between both casual/member users
4
5user_typecasual
6bike_type_count
7frequent_routestrip_countavg_ride_lengthclassic_bikeelectric_bike
8Michigan Ave & 18th St to Michigan Ave & 18th St370:30:09352
9Streeter Dr & Grand Ave to Streeter Dr & Grand Ave330:50:26
10Michigan Ave & Washington St to Michigan Ave & Washington St280:58:06
11Millennium Park to Millennium Park270:25:48
12Chicago Ave & Sheridan Rd to Chicago Ave & Sheridan Rd180:56:41
13Halsted St & Wrightwood Ave to Broadway & Barry Ave170:09:14
14Michigan Ave & 8th St to Michigan Ave & 8th St140:36:40
15Western Ave & Walton St to Ashland Ave & Division St130:07:47
16Michigan Ave & 14th St to Calumet Ave & 18th St130:06:48
17Eastlake Ter & Rogers Ave to Paulina St & Howard St120:06:13
18Clinton St & Roosevelt Rd to Morgan St & 18th St120:08:35
19Michigan Ave & Oak St to Michigan Ave & Oak St120:36:45
20Clark St & Armitage Ave to Clark St & Armitage Ave120:32:16
21Southport Ave & Wellington Ave to Broadway & Barry Ave120:07:26
22Grand Total2600:31:04
frequent_routes_pt
Cells with Conditional Formatting
CellConditionCell FormatStop If True
B8:B40Cell Valuetop 10 valuestextNO
B8:B40Other TypeColor scaleNO


This is the Minisheet displaying the information for the member users displaying the top 10 routes_taken.

December_2020_trimmed.12.17.21.xlsx
BCDEF
2Pivot Table 'Frequented Routes'
3Most frequented routes & stations between both casual/member users
4
5user_typemember
6bike_type_count
7frequent_routestrip_countavg_ride_lengthclassic_bikeelectric_bike
8Dearborn St & Erie St to Dearborn St & Erie St1220:22:24352
9Halsted St & Polk St to Throop St & Taylor St520:06:33
10Broadway & Waveland Ave to Broadway & Barry Ave390:06:20
11Clinton St & Washington Blvd to Dearborn St & Erie St390:10:19
12Franklin St & Monroe St to Clinton St & Lake St380:04:55
13Eastlake Ter & Rogers Ave to Greenview Ave & Jarvis Ave370:08:48
14Bissell St & Armitage Ave to Sheffield Ave & Kingsbury St360:04:31
15Wabash Ave & Grand Ave to Dearborn St & Erie St360:24:09
16Paulina St & Flournoy St to Peoria St & Jackson Blvd360:09:39
17Wabash Ave & Roosevelt Rd to Michigan Ave & 18th St340:05:27
18Clark St & Elm St to Halsted St & Clybourn Ave340:06:58
19Grand Total5030:12:00
frequent_routes_pt
Cells with Conditional Formatting
CellConditionCell FormatStop If True
B8:B40Cell Valuetop 10 valuestextNO
B8:B40Other TypeColor scaleNO


As you can with this Minisheet the bike_type information, as well as the ride_length information, is showing because I had included it in the 'Rows' section of the pivot table.

December_2020_trimmed.12.17.21.xlsx
BCDEF
2Pivot Table 'Frequented Routes'
3Most frequented routes & stations between both casual/member users
4
5user_typecasual
6bike_type_count
7frequent_routestrip_countavg_ride_lengthclassic_bikeelectric_bike
8Michigan Ave & 18th St to Michigan Ave & 18th St370:30:09352
913150 - 13150370:30:09
1000:01:0110:01:01
11classic_bike10:01:01
1200:16:4910:16:49
13classic_bike10:16:49
1400:24:2610:24:26
15classic_bike10:24:26
1600:24:3310:24:33
17classic_bike10:24:33
1800:25:0610:25:06
19classic_bike10:25:06
2000:25:4110:25:41
21classic_bike10:25:41
2200:25:5010:25:50
frequent_routes_pt
Cells with Conditional Formatting
CellConditionCell FormatStop If True
B8:B40Cell Valuetop 10 valuestextNO
B8:B40Other TypeColor scaleNO


What I want to do is extract information from that which is already filtered to the top 10 routes_taken of both members/casual users in the "Frequent Routes" pivot table and create an additional table that solely reflects the bike_type data for those top 10 routes (and could potentially be toggled to see more).

(Side Note: would it be easier to create some sort of SQL/R query to get all this information?)

To clarify: I want the table you have displayed above for the information reflecting the bike_types which should only be classic/electric the docked_bike I eliminated from the dataset. See screenshot:

1639760416388.png


Here is the source data which I converted into a table:

December_2020_trimmed.12.17.21.xlsx
C
9classic_bike
December_2020


Here is a 5-minute Loom video that is describing what I am trying to accomplish and walks-through the steps I took in following your directions to create the table.
 
Upvote 0
In fact, what I think could be done is to manually select those top ten routes as displayed in the 'Frequent Routes' table either for member/casual users. The issue is my excel is lagging like crazy and I can't seem to be able to manually choose the rides without my excel freezing up. The source data currently has about 22,000 rows of data with 380,000 cells. Is that the problem?

Also, if I would potentially be able to manually pick the top ten routes (as reflected in the 'Frequent Routes' pivot table) in my 'Bike Type' pivot table, would I be able to choose the top ten for members and then toggle to casual and choose the top ten and be able to toggle between both member/casual without having to each time manually choose the top ten routes for each.

The goal is to eventually extract the data from the pivot table and create a static table with the data that wouldn't lag as much.

Thoughts?
 
Upvote 0
As you can see here:

1639763736803.png


When I select route_taken to filter, the filter doesn't show up with checkboxes allowing me to select specific routes. I refreshed the table and tried to toggle Select Multiple Items but excel keeps freezing/lagging. Anyway to solve this or is my dataset too large for excel???
 
Upvote 0
@RasGhul Hi,

I think I found a solution to my Pivot Table problem and that was to add a slicer. (I am new to Pivot Tables and excel (advanced features) in general, and am working my way through know what I want but not knowing exactly how to get there with excel).

But this specific Pivot Table still does not fully solve for what I am trying to achieve. What I am trying to achieve is for a Pivot Table to show from among the top ten routes_taken between casual/member users what bike_type was used for that route and how many rides within that route had either a classic_bike or electric_bike.

I did find a workaround by creating two additional columns on the 'Frequent Routes' pivot table and using the =countif function to find classic/electric bikes in the trip information. However only when I expand the + which is beside the route_taken can the bike_count information appear:

December_2020_trimmed.12.17.21.xlsx
BCDEF
2Pivot Table 'Frequented Routes'
3Most frequented routes & stations between both casual/member users
4
5user_typecasualbike_count
6
7frequent_routestrip_countavg_ride_lengthclassic_bikeelectric_bike
8Michigan Ave & 18th St to Michigan Ave & 18th St370:30:09352
frequent_routes_pt
Cell Formulas
RangeFormula
E8E8=COUNTIF(B5:B261, "classic_bike")
F8F8=COUNTIF(B11:B82,"electric_bike")
Cells with Conditional Formatting
CellConditionCell FormatStop If True
B8:B40Cell Valuetop 10 valuestextNO
B8:B40Other TypeColor scaleNO


1639776993948.png
1639777052554.png


See MiniSheet:

December_2020_trimmed.12.17.21.xlsx
BCDEF
2Pivot Table 'Frequented Routes'
3Most frequented routes & stations between both casual/member users
4
5user_typecasualbike_count
6
7frequent_routestrip_countavg_ride_lengthclassic_bikeelectric_bike
8Michigan Ave & 18th St to Michigan Ave & 18th St370:30:09352
913150 - 13150370:30:09
1000:01:0110:01:01
11classic_bike10:01:01
1200:16:4910:16:49
13classic_bike10:16:49
1400:24:2610:24:26
15classic_bike10:24:26
1600:24:3310:24:33
17classic_bike10:24:33
1800:25:0610:25:06
19classic_bike10:25:06
2000:25:4110:25:41
21classic_bike10:25:41
2200:25:5010:25:50
23classic_bike10:25:50
2400:26:1010:26:10
25classic_bike10:26:10
2600:26:1810:26:18
27classic_bike10:26:18
2800:26:1910:26:19
29classic_bike10:26:19
3000:26:2110:26:21
31classic_bike10:26:21
3200:26:2910:26:29
33classic_bike10:26:29
3400:26:4110:26:41
35classic_bike10:26:41
3600:27:0810:27:08
37classic_bike10:27:08
3800:27:3410:27:34
39classic_bike10:27:34
4000:27:3510:27:35
41classic_bike10:27:35
4200:28:2410:28:24
43classic_bike10:28:24
4400:28:3410:28:34
45classic_bike10:28:34
4600:28:3510:28:35
47classic_bike10:28:35
4800:28:4710:28:47
49classic_bike10:28:47
5000:28:5910:28:59
51classic_bike10:28:59
5200:29:0410:29:04
53classic_bike10:29:04
5400:29:1110:29:11
55classic_bike10:29:11
5600:29:2010:29:20
57classic_bike10:29:20
5800:29:2910:29:29
59classic_bike10:29:29
6000:29:3510:29:35
61classic_bike10:29:35
6200:29:4010:29:40
63classic_bike10:29:40
6400:30:1410:30:14
65electric_bike10:30:14
6600:30:3120:30:31
67classic_bike10:30:31
68electric_bike10:30:31
6900:32:1610:32:16
70classic_bike10:32:16
7100:33:1310:33:13
72classic_bike10:33:13
7300:33:3210:33:32
74classic_bike10:33:32
7500:34:0110:34:01
76classic_bike10:34:01
7700:34:5910:34:59
78classic_bike10:34:59
7900:56:0710:56:07
80classic_bike10:56:07
8101:36:1711:36:17
82classic_bike11:36:17
83Streeter Dr & Grand Ave to Streeter Dr & Grand Ave330:50:26
84Michigan Ave & Washington St to Michigan Ave & Washington St280:58:06
85Millennium Park to Millennium Park270:25:48
86Chicago Ave & Sheridan Rd to Chicago Ave & Sheridan Rd180:56:41
87Halsted St & Wrightwood Ave to Broadway & Barry Ave170:09:14
88Michigan Ave & 8th St to Michigan Ave & 8th St140:36:40
89Western Ave & Walton St to Ashland Ave & Division St130:07:47
90Michigan Ave & 14th St to Calumet Ave & 18th St130:06:48
91Eastlake Ter & Rogers Ave to Paulina St & Howard St120:06:13
92Clinton St & Roosevelt Rd to Morgan St & 18th St120:08:35
93Michigan Ave & Oak St to Michigan Ave & Oak St120:36:45
94Clark St & Armitage Ave to Clark St & Armitage Ave120:32:16
95Southport Ave & Wellington Ave to Broadway & Barry Ave120:07:26
96Grand Total2600:31:04
frequent_routes_pt
Cell Formulas
RangeFormula
E8E8=COUNTIF(B5:B261, "classic_bike")
F8F8=COUNTIF(B11:B82,"electric_bike")
Cells with Conditional Formatting
CellConditionCell FormatStop If True
B8:B40Cell Valuetop 10 valuestextNO
B8:B40Other TypeColor scaleNO


One thing that is still getting me to scratch my head is with regard to the route_taken in Column B, I formatted the filter to show only Top 10. But as you can clearly see, there is more than 10 route_taken listed. For casual_user 14 rows are listed (instead of 10) and with member_user 11 rows are listed.

December_2020_trimmed.12.17.21.xlsx
BCDEF
2Pivot Table 'Frequented Routes'
3Most frequented routes & stations between both casual/member users
4
5user_typecasualbike_count
6
7frequent_routestrip_countavg_ride_lengthclassic_bikeelectric_bike
8Michigan Ave & 18th St to Michigan Ave & 18th St370:30:0900
9Streeter Dr & Grand Ave to Streeter Dr & Grand Ave330:50:26
10Michigan Ave & Washington St to Michigan Ave & Washington St280:58:06
11Millennium Park to Millennium Park270:25:48
12Chicago Ave & Sheridan Rd to Chicago Ave & Sheridan Rd180:56:41
13Halsted St & Wrightwood Ave to Broadway & Barry Ave170:09:14
14Michigan Ave & 8th St to Michigan Ave & 8th St140:36:40
15Western Ave & Walton St to Ashland Ave & Division St130:07:47
16Michigan Ave & 14th St to Calumet Ave & 18th St130:06:48
17Eastlake Ter & Rogers Ave to Paulina St & Howard St120:06:13
18Clinton St & Roosevelt Rd to Morgan St & 18th St120:08:35
19Michigan Ave & Oak St to Michigan Ave & Oak St120:36:45
20Clark St & Armitage Ave to Clark St & Armitage Ave120:32:16
21Southport Ave & Wellington Ave to Broadway & Barry Ave120:07:26
22Grand Total2600:31:04
frequent_routes_pt
Cell Formulas
RangeFormula
E8E8=COUNTIF(B5:B261, "classic_bike")
F8F8=COUNTIF(B11:B82,"electric_bike")
Cells with Conditional Formatting
CellConditionCell FormatStop If True
B8:B40Cell Valuetop 10 valuestextNO
B8:B40Other TypeColor scaleNO


Any answers for this?
 
Upvote 0
Ok we have a few different questions here and maybe you may need to split your pivot tables to suit the answer you are looking for but yes Slicers are the best way to go for snapshot filtering of your data.

You can also link Slicers to multiple pivot tables so you can have 1 pivot only returning bike type / Count & AVG - then another pivot table with the expanded ride_id's etc that will change together at the same time. This will save you doing your Countifs table next to your pivots...

When thinking about your pivot table fields
  • Filters - "What data do I want to include in this analysis?"
  • Rows - "What data do I want to see displayed?"
So to simply to make sure we're only getting the top 10 routes of data 1st

Pivot table F= User_type, Rows = route_taken, Values = Count of user_type & Avg ride length here's my output which is 10 rows

Count and order (from A-Z) number of recurring text strings_zgoldflo.xlsx
ABC
1
2user_type(All)
3
4Row LabelsCount of user_typeAverage of ride_length
5Clark St & Lincoln Ave to Halsted St & Clybourn Ave1200:18:24
6Orleans St & Merchandise Mart Plaza to Halsted St & Clybourn Ave600:12:03
7Larrabee St & North Ave to Halsted St & Clybourn Ave500:16:14
8Michigan Ave & Pearson St to Halsted St & Clybourn Ave400:23:57
9Michigan Ave & 18th St to Halsted St & Clybourn Ave200:30:32
10Green St & Randolph St to Halsted St & Clybourn Ave200:13:36
11Wilton Ave & Belmont Ave to Halsted St & Clybourn Ave200:15:03
12Greenview Ave & Fullerton Ave to Halsted St & Clybourn Ave200:10:57
13Clark St & Chicago Ave to Halsted St & Clybourn Ave200:09:40
14Lake Shore Dr & Ohio St to Halsted St & Clybourn Ave200:18:21
15Grand Total3900:17:05
16
Sheet1


Doubly click on the 1st value of Count in the pivot table, a new sheet will be automatically generated by excel, only containing the data related to your pivot.

You can then extract this "Filtered data" data based on my PT fields and export to a new workbook for analysis. With the benefit of this being you can work with this smaller amount of data without your larger data set being open in an active workbook.

Count and order (from A-Z) number of recurring text strings_zgoldflo.xlsx
ABCDEFGHIJKLMNOP
1ride_iduser_typerideable_typeday_of_weekstarted_atended_atride_lengthride_length_convertstart_station_nameend_station_nameroute_takenstart_station_idend_station_idstart_coordinatesend_coordinatesdistance_traveled_miles
2E0D35323A3F37120memberclassic_bike42020-12-30T14:30:00Z2020-12-30T14:41:00Z12:11:36 AM12:11:36 AMClark St & Lincoln AveHalsted St & Clybourn AveClark St & Lincoln Ave to Halsted St & Clybourn Ave1317933141.915689, -87.634641.909668, -87.6481280.810492488
303926929025B28C4casualclassic_bike32020-12-29T10:29:00Z2020-12-29T10:39:00Z12:10:30 AM12:10:30 AMClark St & Lincoln AveHalsted St & Clybourn AveClark St & Lincoln Ave to Halsted St & Clybourn Ave1317933141.915689, -87.634641.909668, -87.6481280.810492488
4D084CF51C605C6F1memberclassic_bike32020-12-29T10:28:00Z2020-12-29T10:39:00Z12:10:44 AM12:10:44 AMClark St & Lincoln AveHalsted St & Clybourn AveClark St & Lincoln Ave to Halsted St & Clybourn Ave1317933141.915689, -87.634641.909668, -87.6481280.810492488
506C887C108F035ABmemberclassic_bike12020-12-27T14:02:00Z2020-12-27T14:14:00Z12:11:30 AM12:11:30 AMClark St & Lincoln AveHalsted St & Clybourn AveClark St & Lincoln Ave to Halsted St & Clybourn Ave1317933141.915689, -87.634641.909668, -87.6481280.810492488
65C13C2A9F537FAF4memberclassic_bike22020-12-14T15:43:00Z2020-12-14T15:53:00Z12:09:19 AM12:09:19 AMClark St & Lincoln AveHalsted St & Clybourn AveClark St & Lincoln Ave to Halsted St & Clybourn Ave1317933141.915689, -87.634641.909668, -87.6481280.810492488
782B443DA84AA3BEEmemberclassic_bike22020-12-14T14:55:00Z2020-12-14T15:03:00Z12:08:14 AM12:08:14 AMClark St & Lincoln AveHalsted St & Clybourn AveClark St & Lincoln Ave to Halsted St & Clybourn Ave1317933141.915689, -87.634641.909668, -87.6481280.810492488
85B9A60CCDD6A98C0memberclassic_bike72020-12-12T19:25:00Z2020-12-12T19:32:00Z12:06:46 AM12:06:46 AMClark St & Lincoln AveHalsted St & Clybourn AveClark St & Lincoln Ave to Halsted St & Clybourn Ave1317933141.915689, -87.634641.909668, -87.6481280.810492488
9EB83EB7EC542A6FBmemberclassic_bike52020-12-10T09:43:00Z2020-12-10T09:53:00Z12:09:40 AM12:09:40 AMClark St & Lincoln AveHalsted St & Clybourn AveClark St & Lincoln Ave to Halsted St & Clybourn Ave1317933141.915689, -87.634641.909668, -87.6481280.810492488
10CAAABC0E9EA76453memberclassic_bike12020-12-06T15:48:00Z2020-12-06T15:57:00Z12:08:57 AM12:08:57 AMClark St & Lincoln AveHalsted St & Clybourn AveClark St & Lincoln Ave to Halsted St & Clybourn Ave1317933141.915689, -87.634641.909668, -87.6481280.810492488
11AFE6DE4D8061D6F5memberclassic_bike12020-12-06T14:54:00Z2020-12-06T15:04:00Z12:09:10 AM12:09:10 AMClark St & Lincoln AveHalsted St & Clybourn AveClark St & Lincoln Ave to Halsted St & Clybourn Ave1317933141.915689, -87.634641.909668, -87.6481280.810492488
12BCC1E5EEDBB31529casualclassic_bike12020-12-06T12:12:00Z2020-12-06T13:15:00Z1:02:04 AM1:02:04 AMClark St & Lincoln AveHalsted St & Clybourn AveClark St & Lincoln Ave to Halsted St & Clybourn Ave1317933141.915689, -87.634641.909668, -87.6481280.810492488
139F21F589917D69CCcasualclassic_bike12020-12-06T12:12:00Z2020-12-06T13:15:00Z1:02:14 AM1:02:14 AMClark St & Lincoln AveHalsted St & Clybourn AveClark St & Lincoln Ave to Halsted St & Clybourn Ave1317933141.915689, -87.634641.909668, -87.6481280.810492488
Sheet6


*Clark st & Lincoln Ave has highest ride count, If I now add route_taken to the Filter and select Clark St & Lincoln and have rideable_type in Rows here is my output;

Count and order (from A-Z) number of recurring text strings_zgoldflo.xlsx
ABC
1user_type(All)
2route_takenClark St & Lincoln Ave to Halsted St & Clybourn Ave
3
4Row LabelsCount of user_typeAverage of ride_length
5classic_bike1200:18:24
6Grand Total1200:18:24
7
Sheet1


I hope this helps
 
Upvote 0
@RasGhul Thanks for that.

I actually found another workaround which was simply adjusting the order of the values how they appeared in the "ROWS" section of the Pivot Table. When placing bike_type directly after user_type I was able to quickly extract the averages per route_taken per bike_type. From there it was simply (finding a few inconsistencies adjusting and) inputting the totals. Here is the finished product for the 'Frequent Routes' pivot table.

Some columns might look funny because I added color and the gradient fill effect.

December_2020_trimmed.12.20.21.xlsx
BCDEFGHIJKL
3Pivot Table 'Frequented Routes'
4Most frequented routes & stations between both casual/member users
5
6user_typecasualbike_count & avg_ridebike_count & avg_ride
7casual_usermember_user
8frequent_routestrip_countroute_ride_avgclassic_bikeride_classic_avgelectric_bikeride_electric_avgclassic_bikeride_classic_avgelectric_bikeride_electric_avg
9Michigan Ave & 18th St to Michigan Ave & 18th St370:30:09350:30:0820:30:2270:17:461150:22:41
10Streeter Dr & Grand Ave to Streeter Dr & Grand Ave330:50:26260:54:1570:36:13470:06:4550:04:42
11Michigan Ave & Washington St to Michigan Ave & Washington St280:58:06231:02:0750:39:39370:06:2420:04:59
12Millennium Park to Millennium Park270:25:48220:24:3550:31:09250:10:38140:09:45
13Chicago Ave & Sheridan Rd to Chicago Ave & Sheridan Rd180:56:41150:59:5330:40:44330:05:0550:03:52
14Halsted St & Wrightwood Ave to Broadway & Barry Ave170:09:1440:21:06130:05:35290:10:1080:03:49
15Michigan Ave & 8th St to Michigan Ave & 8th St140:36:40110:43:4030:11:02320:04:4040:03:20
16Western Ave & Walton St to Ashland Ave & Division St130:07:47130:07:470090:11:51270:28:16
17Michigan Ave & 14th St to Calumet Ave & 18th St130:06:4880:07:4750:05:24330:09:4830:08:02
18Eastlake Ter & Rogers Ave to Paulina St & Howard St120:06:1370:06:4050:05:36300:05:3240:04:45
19Clinton St & Roosevelt Rd to Morgan St & 18th St120:08:3510:09:18110:08:31150:08:08190:06:03
20Michigan Ave & Oak St to Michigan Ave & Oak St120:36:4580:28:5640:52:25
21Clark St & Armitage Ave to Clark St & Armitage Ave120:32:1670:34:3750:28:58
22Southport Ave & Wellington Ave to Broadway & Barry Ave120:07:2620:07:50100:07:21
23Grand Total2600:31:041820:30:04780:22:442970:08:482060:09:07
frequent_routes_pt
Cell Formulas
RangeFormula
E23,G23E23=SUM(E9:E22)
F23,H23F23=AVERAGE(F9:F21)
I23,K23I23=SUM(I9:I19)
J23,L23J23=AVERAGE(J9:J19)
Cells with Conditional Formatting
CellConditionCell FormatStop If True
E6:E7Other TypeColor scaleNO
B9:B24Cell Valuetop 10 valuestextNO
B9:B24Other TypeColor scaleNO


I have a final Pivot Table I am looking to create and am not sure how to approach it or implement it. I am looking to create a 'Shared Routes' table that will include the top ten most shared routes among member/casual users. I am not sure how I could begin to extract that information from the source data. Perhaps something like an SQL query would be the best way to do so.

How I envision it to look is somewhere along the lines of the following:

December_2020_trimmed.12.20.21.xlsx
OPQRSTUVWXY
5Pivot Table 'Shared Routes'
6Most shared routes & stations among casual/member users
7
8
9trip_countbike_count & avg_ridebike_count & avg_ride
10member_usercasual_user
11shared_routesmembercasualclassic_bikeride_classic_avgelectric_bikeride_electric_avgclassic_bikeride_classic_avgelectric_bikeride_electric_avg
12<route_name><number><number><number><avg><number><avg>
13<route_name>
14<route_name>
15<route_name>
16<route_name>
17<route_name>
18
19<total><total><total><total><total><total><total><total><total><total>
20<grand total><grand total>
frequent_routes_pt


Any suggestions on how I could begin extracted the most shared routes among casual and member users?
 
Upvote 0
In post #17 if they are Pivot tables right click on the 1st route e.g. Michigan Ave & 18th st, then select Filter / Choose Top 10

If your looking for a static table using formulas

Count and order (from A-Z) number of recurring text strings_zgoldflo.xlsx
ABCDEFGHIJK
1Pivot Table 'Shared Routes'
2Most shared routes & stations among casual/member users
3
4Rows Count
510trip_countbike_count & avg_ridebike_count & avg_ride
6membercasual
7shared_routesmembercasualclassic_bikeride_classic_avgelectric_bikeride_electric_avgclassic_bikeride_classic_avgelectric_bikeride_electric_avg
8Clark St & Lincoln Ave to Halsted St & Clybourn Ave93900:09:33000:00:00300:44:56000:00:00
9Orleans St & Merchandise Mart Plaza to Halsted St & Clybourn Ave51400:12:35100:10:12000:00:00100:11:45
10Larrabee St & North Ave to Halsted St & Clybourn Ave41400:17:01000:00:00100:13:05000:00:00
11Michigan Ave & Pearson St to Halsted St & Clybourn Ave22200:19:17000:00:00000:00:00200:28:36
12Greenview Ave & Fullerton Ave to Halsted St & Clybourn Ave11100:11:19000:00:00100:10:36000:00:00
13Clark St & Chicago Ave to Halsted St & Clybourn Ave20200:09:40000:00:00000:00:00000:00:00
14Wilton Ave & Belmont Ave to Halsted St & Clybourn Ave20200:15:03000:00:00000:00:00000:00:00
15Michigan Ave & 18th St to Halsted St & Clybourn Ave20200:30:32000:00:00000:00:00000:00:00
16Green St & Randolph St to Halsted St & Clybourn Ave20200:13:35000:00:00000:00:00000:00:00
17Lake Shore Dr & Ohio St to Halsted St & Clybourn Ave20200:18:20000:00:00000:00:00000:00:00
183183002:36:57100:10:12501:08:37300:40:21
19393102:47:09801:48:58
20
Sheet1
Cell Formulas
RangeFormula
A8:A17A8=INDEX(UNIQUE(SORTBY(FILTER(Table1[route_taken],Table1[Frequency]>0),Table1[Frequency],-1)),SEQUENCE($A$5))
B8:C17B8=COUNTIFS(Table1[user_type],B$7,Table1[route_taken],$A8)
D8:D17,F8:F17D8=COUNTIFS(Table1[user_type],$D$6,Table1[route_taken],$A8,Table1[rideable_type],D$7)
E8:E17E8=IFERROR(AVERAGEIFS(Table1[ride_length_convert],Table1[route_taken],$A8,Table1[user_type],$D$6,Table1[rideable_type],$D$7),0)
G8:G17G8=IFERROR(AVERAGEIFS(Table1[ride_length_convert],Table1[route_taken],$A8,Table1[user_type],$D$6,Table1[rideable_type],$F$7),0)
H8:H17,J8:J17H8=COUNTIFS(Table1[user_type],$H$6,Table1[route_taken],$A8,Table1[rideable_type],H$7)
I8:I17I8=IFERROR(AVERAGEIFS(Table1[ride_length_convert],Table1[route_taken],$A8,Table1[user_type],$H$6,Table1[rideable_type],$H$7),0)
K8:K17K8=IFERROR(AVERAGEIFS(Table1[ride_length_convert],Table1[route_taken],$A8,Table1[user_type],$H$6,Table1[rideable_type],$J$7),0)
B18:K18B18=SUM(B8:B17)
B19B19=SUM(B18:C18)
D19,H19D19=SUM(D18,F18)
G19,K19G19=SUM(E18,G18)
Dynamic array formulas.
 
Upvote 0
zgold pls note that I added a column called frequency to the end of my sample data with

Excel Formula:
=COUNTIFS($K$2:K2,K2)

which feeds

Excel Formula:
=INDEX(UNIQUE(SORTBY(FILTER(Table1[route_taken],Table1[Frequency]>0),Table1[Frequency],-1)),SEQUENCE($A$5))
 
Upvote 0
@RasGhul Oh wow. Thank you for your time and continued effort to help.

That table looks gorgeous. I'm going to need to understand those formulas to be able to implement them correctly on the current data I have.

In reference to what you mentioned about SORT BY > TOP 10. I have that already implemented on my Pivot Tables. (I mentioned previously, the odd thing is that the TOP 10 filter has added more than 10 rows for my TOP 10 - perhaps it may be because there are more than one 'trip_count' that have the same values i.e. two different route_taken that have the same number of trip_count?)

Aside from that, are you saying that if I have the TOP 10 filter already implemented on my Pivot Table and I toggle the Table to include for example 'All results' I would be seeing the results for the most shared_routes among casual and member users?

Below on my Pivot Table, I numbered both member and casual route_taken by top results (e.g. '1m' for the top route for member users and '1c' for the top route by casual users). The yellow is member top routes (which also seem to be the top shared_route as well) while the orange is casual top routes.

What I mean by TOP SHARED ROUTES are routes that have the highest number of both member and casual users ** i.e. the most balanced 1:1 ratio between the two **. The objective is to list those shared_routes from highest to lowest. (The analysis goal is to consider why those routes attract both rider types equally i.e. what about those routes make them just as appealing to member users as casual users).

I don't understand how the table below with the toggled 'All results' / 'Multiple Items' is showing for the most balanced distribution between both member/casual users?

December_2020_trimmed.12.20.21.607.V.xlsx
BCDEFGHIJKL
3Pivot Table 'Frequented Routes'
4Most frequented routes & stations between both casual/member users
5
6user_type(Multiple Items)bike_count & avg_ridebike_count & avg_ride
7casual_usermember_user
8frequent_routestrip_countroute_ride_avgclassic_bikeride_classic_avgelectric_bikeride_electric_avgclassic_bikeride_classic_avgelectric_bikeride_electric_avg
9Dearborn St & Erie St to Dearborn St & Erie St -- (1m)1270:21:58350:30:0820:30:2270:17:461150:22:41
10Halsted St & Polk St to Throop St & Taylor St -- (2m)520:06:33260:54:1570:36:13470:06:4550:04:42
11Streeter Dr & Grand Ave to Streeter Dr & Grand Ave -- (2c)470:41:15231:02:0750:39:39370:06:2420:04:59
12Michigan Ave & 18th St to Michigan Ave & 18th St -- (1c)430:28:53220:24:3550:31:09250:10:38140:09:45
13Broadway & Waveland Ave to Broadway & Barry Ave -- (3m)420:06:18150:59:5330:40:44330:05:0550:03:52
14Clinton St & Washington Blvd to Dearborn St & Erie St -- (4m)390:10:1940:21:06130:05:35290:10:1080:03:49
15Franklin St & Monroe St to Clinton St & Lake St -- (5m)380:04:55110:43:4030:11:02320:04:4040:03:20
16Eastlake Ter & Rogers Ave to Greenview Ave & Jarvis Ave -- (6m)380:08:48130:07:470090:11:51270:28:16
17Wabash Ave & Roosevelt Rd to Michigan Ave & 18th St -- (10m)370:05:2480:07:4750:05:24330:09:4830:08:02
18Wabash Ave & Grand Ave to Dearborn St & Erie St -- (8m)360:24:0970:06:4050:05:36300:05:3240:04:45
19Bissell St & Armitage Ave to Sheffield Ave & Kingsbury St -- (7m)360:04:3110:09:18110:08:31150:08:08190:06:03
20Paulina St & Flournoy St to Peoria St & Jackson Blvd -- (9m)360:09:3980:28:5640:52:25
21Michigan Ave & Washington St to Michigan Ave & Washington St -- (3c)360:46:4470:34:3750:28:58
22Grand Total6070:17:4420:07:50100:07:21
231820:30:04780:22:442970:08:482060:09:07
frequent_routes_pt
Cell Formulas
RangeFormula
E23,G23E23=SUM(E9:E22)
F23,H23F23=AVERAGE(F9:F21)
I23,K23I23=SUM(I9:I19)
J23,L23J23=AVERAGE(J9:J19)
Cells with Conditional Formatting
CellConditionCell FormatStop If True
E6:E7Other TypeColor scaleNO
B9:B24Cell Valuetop 10 valuestextNO
B9:B24Other TypeColor scaleNO
 
Upvote 0

Forum statistics

Threads
1,214,935
Messages
6,122,337
Members
449,078
Latest member
skydd

We've detected that you are using an adblocker.

We have a great community of people providing Excel help here, but the hosting costs are enormous. You can help keep this site running by allowing ads on MrExcel.com.
Allow Ads at MrExcel

Which adblocker are you using?

Disable AdBlock

Follow these easy steps to disable AdBlock

1)Click on the icon in the browser’s toolbar.
2)Click on the icon in the browser’s toolbar.
2)Click on the "Pause on this site" option.
Go back

Disable AdBlock Plus

Follow these easy steps to disable AdBlock Plus

1)Click on the icon in the browser’s toolbar.
2)Click on the toggle to disable it for "mrexcel.com".
Go back

Disable uBlock Origin

Follow these easy steps to disable uBlock Origin

1)Click on the icon in the browser’s toolbar.
2)Click on the "Power" button.
3)Click on the "Refresh" button.
Go back

Disable uBlock

Follow these easy steps to disable uBlock

1)Click on the icon in the browser’s toolbar.
2)Click on the "Power" button.
3)Click on the "Refresh" button.
Go back
Back
Top