Hi, everybody,
I really really need help.
Imagine a doctor's office. Some of the patients have just arrived and are being processed by the receptionist (phase 1) and this takes some time (interval 1), some of them are waiting (phase 2 and interval 2) and some of them are already with the doctor (phase 3 and interval 3).
What I need is a way to be able to figure out how many patients were in which »phase/ interval« at a specific hour of the previous day, but I also have to be able to filter between different categories of patients. There are around 100 patients in one day. I also need to put it in a chart, that will look something like this:

(blue line phase 1, orange line phase 2 and grey line- phase 3)
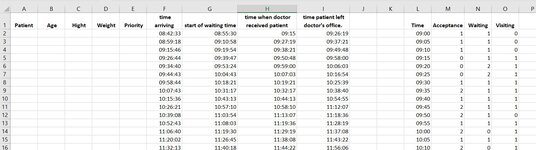
My data:
So, the interval 1 is the interval between “time arriving” and “start of waiting time”
The interval 2 is the interval between “start of waiting time” and “time when doctor received a patient” and
The interval 3 is the interval between “time when doctor received a patient” and “time patient left doctor's office”.
So the question is, how many patients were being processed, how many were waiting and how many were seeing a doctor at Sep 19, 2021 9:42:53 pm?
Can I do it with a pivot table?
Thank you so much for your help
I really really need help.
Imagine a doctor's office. Some of the patients have just arrived and are being processed by the receptionist (phase 1) and this takes some time (interval 1), some of them are waiting (phase 2 and interval 2) and some of them are already with the doctor (phase 3 and interval 3).
What I need is a way to be able to figure out how many patients were in which »phase/ interval« at a specific hour of the previous day, but I also have to be able to filter between different categories of patients. There are around 100 patients in one day. I also need to put it in a chart, that will look something like this:
(blue line phase 1, orange line phase 2 and grey line- phase 3)
My data:
- Patient 1; Age; Hight; Weight; Priority; time arriving; start of waiting time; time when doctor received patient 1; time patient 1 left doctor's office.
- Patient 2…
So, the interval 1 is the interval between “time arriving” and “start of waiting time”
The interval 2 is the interval between “start of waiting time” and “time when doctor received a patient” and
The interval 3 is the interval between “time when doctor received a patient” and “time patient left doctor's office”.
So the question is, how many patients were being processed, how many were waiting and how many were seeing a doctor at Sep 19, 2021 9:42:53 pm?
Can I do it with a pivot table?
Thank you so much for your help