inferno657
New Member
- Joined
- Aug 11, 2022
- Messages
- 12
- Office Version
- 365
- Platform
- Windows
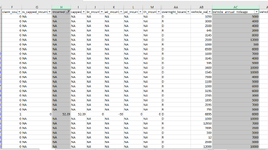
I would like to show the correlation between vehicle annual mileage and the amount incurred in a claim. For bivariate continuous data such as this, I think a scatter plot would be best. How can I do this? Note: the 'incurred' column contains some non-numerical values such as NA.