Hello, this is my first post! Pleasure to join the forum.
So I am trying to create a double axis chart, one will be a bar chart and the other will be a line chart. I have four locations I want to do this for, but if I have the data for all four countries then the visuals will be way too crammed. Here is some of the data below:
<colgroup><col><col><col><col><col><col><col><col><col></colgroup><tbody>
</tbody>
And here is the chart for just one of the tables (one table for each country).

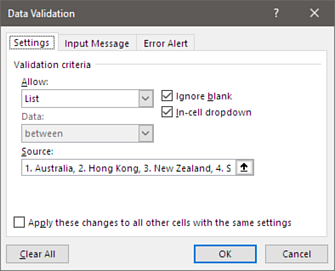
Essentially, if I can have a drop down list above the legend, where I can choose either Australia, Singapore, Hong Kong or New Zealand, then someone viewing the chart can have all the data here and select accordingly.
Thanks, and apologies if I broke any rules in how I posted. I read the rules, but not entirely. I will fix the thread if there is something blatantly wrong.
So I am trying to create a double axis chart, one will be a bar chart and the other will be a line chart. I have four locations I want to do this for, but if I have the data for all four countries then the visuals will be way too crammed. Here is some of the data below:
| Date | Australia Conversions | Australia CPA | Hong Kong Conversions | Hong Kong CPA | New Zealand Conversions | New Zealand CPA | SingaporeConversions | Singapore CPA |
| 8/1/2009 | 10 | 27.259 | 4 | 15.5675 | 4 | 23.4875 | 21 | 9.514285714 |
| 8/2/2009 | 11 | 31.68181818 | 1 | 67.57 | 4 | 47.445 | 10 | 23.264 |
<colgroup><col><col><col><col><col><col><col><col><col></colgroup><tbody>
</tbody>
And here is the chart for just one of the tables (one table for each country).
Essentially, if I can have a drop down list above the legend, where I can choose either Australia, Singapore, Hong Kong or New Zealand, then someone viewing the chart can have all the data here and select accordingly.
Thanks, and apologies if I broke any rules in how I posted. I read the rules, but not entirely. I will fix the thread if there is something blatantly wrong.