Creating an algorithm or formula to generate a nonlinear increase in values between a specified range

ddub25

Well-known Member
Joined
Jan 11, 2007
Messages
617
Office Version
  1. 2019
Platform
  1. Windows
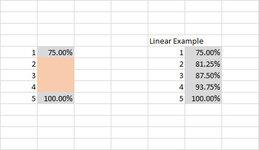
I am trying to create a table that can generate a nonlinear increase in values between 75% and 100%. I have attached a picture of my spreadsheet - the table on the left being the one that wants to generate percentage values for table rows 2,3 and 4 between 75% and 100%. The table to the right is an example of a linear increase in the percentage values (each increase in percentage is by 6.25%).

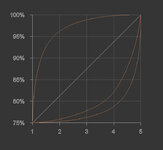
I have also attached a picture of what a graph may look like, showing nonlinear curve examples in orange as opposed to the linear line in white. I would like to be able to generate a natural, smooth curve shape of my choice by having the helper/input cells required to skew the curve in a nonlinear fashion and being able to bias the curve to fall off sharper to the end or sharper at the beginning. I want to be able to go through the process of testing different, nonlinear arcs and so will be creating a curve, testing it, creating another curve, testing it and so on.

If anyone can offer some help or point me in the right direction it would be greatly appreciated. Thanks

Dan W
 

Attachments

  • Nonlinear Values Calculator_GraphExample.jpg
    Nonlinear Values Calculator_GraphExample.jpg
    68.4 KB · Views: 37
  • Nonlinear Values Calculator_SpreadsheetPIC.jpg
    Nonlinear Values Calculator_SpreadsheetPIC.jpg
    35.1 KB · Views: 36
I wondered what sort of image a trigonometric curve would deliver. This is much more symmetrical, it does not deliver quite the style of curve in your original statement.
Linear_vs_Sin.png
 
Upvote 0

Excel Facts

How to create a cell-sized chart?
Tiny charts, called Sparklines, were added to Excel 2010. Look for Sparklines on the Insert tab.
Thanks Stephen, I overlooked the fact that the Lim25 columns were fixed to 25 (the sum of 100 – 75). I adapted the sheet to have OldMax automatically get its value and the Lim25 columns to reference OldMax. Now I can enter my range values and it works great so thanks very much for you help – it is greatly appreciated.

Is the trigonometric curve just a different way of representing graphically or are there different calculations within the tables? I am not to worried about the graphical output – I am just using that to get a visual understanding for myself of how nonlinear the values are and whether I need to make adjustments.
 
Upvote 0
The trig curve is different but not by much. Here is a mini sheet of the data points.

Cell Formulas
RangeFormula
C4:C12C4=ShiftVal+G4
D4:D12D4=ShiftVal+I4
E4:E12E4=ShiftVal+K4
G4:G12G4=OldMin*B4*OldMax/IncrDiv
H4:H12H4=SIN(MyRad*B4/MaxTrig)
I4:I12I4=H4*25/MaxSin
J4:J12J4=I4-G4
K4:K12K4=G4-J4
Named Ranges
NameRefers ToCells
IncrDiv=Sheet1!$B$12G4:G12
MaxSin=Sheet2!$H$12I4:I12
MaxTrig=Sheet2!$F$12H4:H12
MyRad=Sheet2!$H$2H4:H12
OldMax=Sheet1!$F$12G4:G12
OldMin=Sheet1!$F$4G4:G12
ShiftVal=Sheet1!$A$4C4:E12
 
Upvote 0
Ok, thanks Stephen, I will compare the two when I get a chance. Thanks again for all your help - I am very grateful.

Dan W
 
Upvote 0

Forum statistics

Threads
1,214,905
Messages
6,122,172
Members
449,071
Latest member
cdnMech

We've detected that you are using an adblocker.

We have a great community of people providing Excel help here, but the hosting costs are enormous. You can help keep this site running by allowing ads on MrExcel.com.
Allow Ads at MrExcel

Which adblocker are you using?

Disable AdBlock

Follow these easy steps to disable AdBlock

1)Click on the icon in the browser’s toolbar.
2)Click on the icon in the browser’s toolbar.
2)Click on the "Pause on this site" option.
Go back

Disable AdBlock Plus

Follow these easy steps to disable AdBlock Plus

1)Click on the icon in the browser’s toolbar.
2)Click on the toggle to disable it for "mrexcel.com".
Go back

Disable uBlock Origin

Follow these easy steps to disable uBlock Origin

1)Click on the icon in the browser’s toolbar.
2)Click on the "Power" button.
3)Click on the "Refresh" button.
Go back

Disable uBlock

Follow these easy steps to disable uBlock

1)Click on the icon in the browser’s toolbar.
2)Click on the "Power" button.
3)Click on the "Refresh" button.
Go back
Back
Top