Sub WriteBinomials_1()
'Assumptions: this macro will be run with the raw data sheet active
'The raw data w/headers will be in BV1:BY? with no other entries below the raw data in col BV
'Output will be written to a new sheet "Output" in cols A:E starting in A2
'output exceeding BlockCount rows will be redirected to cols G:K, M:Q, ...
Const BlockCount As Long = 1000000 'Number of rows in a block of output - not to exceed rows.count-1
Dim Rall As Range, Vall As Variant
Dim R() As Range, Rin As Range, Vin As Variant, Vout As Variant, dataSht As Worksheet, outputSht As Worksheet
Dim i As Long, m As Long, j As Long, k As Long, Ars As Long, First As Long, Last As Long, Ct As Long
Set dataSht = ActiveSheet
Set Rall = dataSht.Range("BV2:BY" & dataSht.Cells(Rows.Count, "BV").End(xlUp).Row)
Vall = Rall.Value
If Val(Vall(1, 1)) > BlockCount Then
MsgBox "WinterAtRisk values must be <= " & BlockCount
Exit Sub
End If
Ars = 1 + Round(Application.Sum(Rall.Columns(1)) / BlockCount, 0) 'number of areas needed for output with overflow
For i = 1 To UBound(Vall, 1)
S = S + Val(Vall(i, 1))
If S > BlockCount Then
First = Last + 1
Last = i - 1
Ct = Ct + 1
ReDim Preserve R(1 To Ct)
Set R(Ct) = dataSht.Range(Rall.Rows(First), Rall.Rows(Last))
S = Val(Vall(i, 1))
ElseIf i = UBound(Vall, 1) Then
First = Last + 1
Last = i
Ct = Ct + 1
ReDim Preserve R(1 To Ct)
Set R(Ct) = dataSht.Range(Rall.Rows(First), Rall.Rows(Last))
End If
Next i
With Application
.ScreenUpdating = False
.DisplayAlerts = False
End With
On Error Resume Next
Sheets("Output").Delete
On Error GoTo 0
Set outputSht = Sheets.Add
outputSht.Name = "Output"
For i = 1 To Ars
With outputSht.Range("A:E").Offset(0, (i - 1) * 6).Resize(1, 5)
.ClearContents
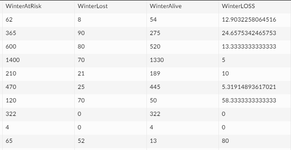
.Rows(1).Value = Array("Alive/Lost", "WinterAtRisk", "WinterLost", "WinterAlive", "WinterLOSS")
.EntireColumn.AutoFit
End With
Next i
For i = 1 To Ars
Set Rin = R(i)
Vin = Rin.Value
For m = 1 To UBound(Vin, 1)
ReDim Vout(1 To Vin(m, 1), 1 To UBound(Vin, 2) + 1)
For j = 1 To UBound(Vout, 1)
If j <= Vin(m, 2) Then
Vout(j, 1) = 1
For k = 2 To 5
Vout(j, k) = Vin(m, k - 1)
Next k
Else
Vout(j, 1) = 0
For k = 2 To 5
Vout(j, k) = Vin(m, k - 1)
Next k
End If
Next j
outputSht.Cells(Rows.Count, 1 + (i - 1) * 6).End(xlUp).Offset(1).Resize(UBound(Vout, 1), 5).Value = Vout
Erase Vout
Next m
Next i
With Application
.ScreenUpdating = True
.DisplayAlerts = True
End With
End Sub