ripvanbrown
New Member
- Joined
- Jul 17, 2012
- Messages
- 8
- Office Version
- 365
- Platform
- Windows
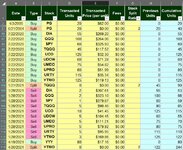
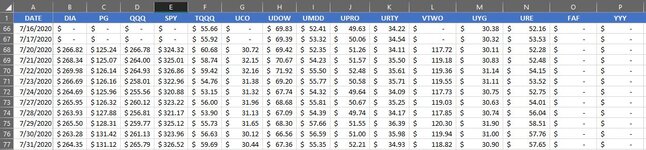
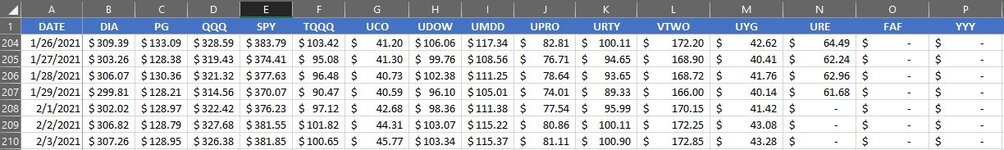
I have a workbook that tracks stock portfolio transactions (buys, sells, splits, dividends, etc.) on one tab (TRANSACTIONS) that also records net cumulative units per transaction. I also have a separate tab (PRICE HISTORY) that captures the daily closing price of all equity holdings by ticker symbol. On any given day, I can see the present daily portfolio value by equity and the total value. However, I'm wanting to track the historical daily portfolio value based on the number of net cumulative shares held on any given day. I've tried several combinations of VLOOKUP, INDEX, & MATCH and PIVOT TABLE but can't seem to get it since it seems to be a triple lookup (return Cumulative Units of all outstanding equities based on Stock ticker symbol for a given date; then multiply that by the lookup of the historical price to get price per equity position, then grand total for daily historical portfolio market value). I want to be able to track the daily total portfolio market value so that I can perform other calculations (e.g. MTD, QTD, YTD returns, etc.), and to also chart it. I can't simply use the current daily value because I don't always get the chance to record it everyday. While I can find several dozen stock portfolio tracker templates, I can't find one that tracks daily historical portfolio values based on then-current shares per equity position. Although I'm ultimately looking for all historical data, I provided price history tables In the examples to see the significant portfolio value changes on 7/21/2020 before the purchases on 7/22/2020 (it should only register 40 shares of PG), the portfolio value on 7/22/202 after the purchase of the 10 equities, and the value on 1/29/2021 to see the value and correct shares after the sale transactions. Thank you!