Up-down bars cannot support labels. You would need to add another element to the chart that does support labels. Here are two approaches:
Method 1. Don't use up-down bars at all but instead use stacked columns to add the floating bar.
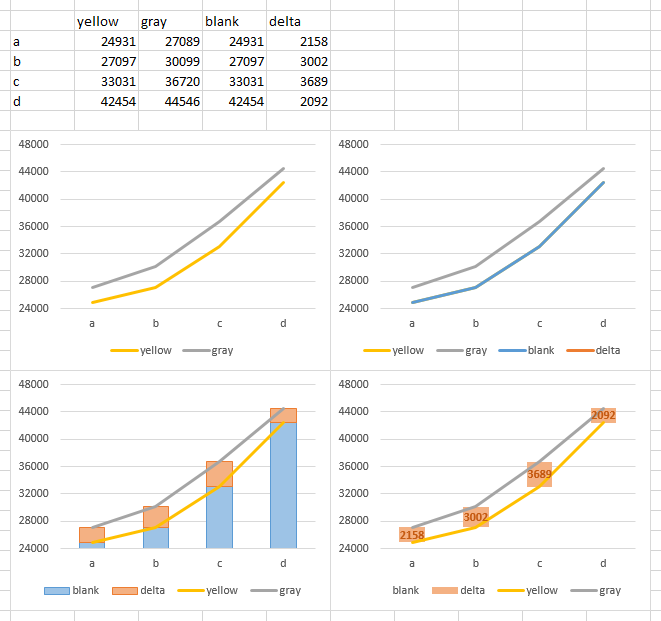
Here is the data I used for my example. The yellow and gray columns are your original data. I added "blank", which is the same as the minimum (yellow), and "delta" which is the maximum minus minimum (gray minus yellow).
The top left chart is your original, without the up-down bars. I've added the two additional columns in the top right chart, and at first they appear as more lines. Blank covers yellow because the values are the same, delta doesn't appear because the values fall below the axis minimum.
In the bottom left chart I've converted the added two series from lines to stacked columns. In the bottom right, I've formatted blank to use no border and no fill, so it is blank. I've added data labels to the delta series, and they show the calculated difference by default, since that is the value of the bars.
Method 2. Add a hidden line at the midpoint, and add data labels to this line.
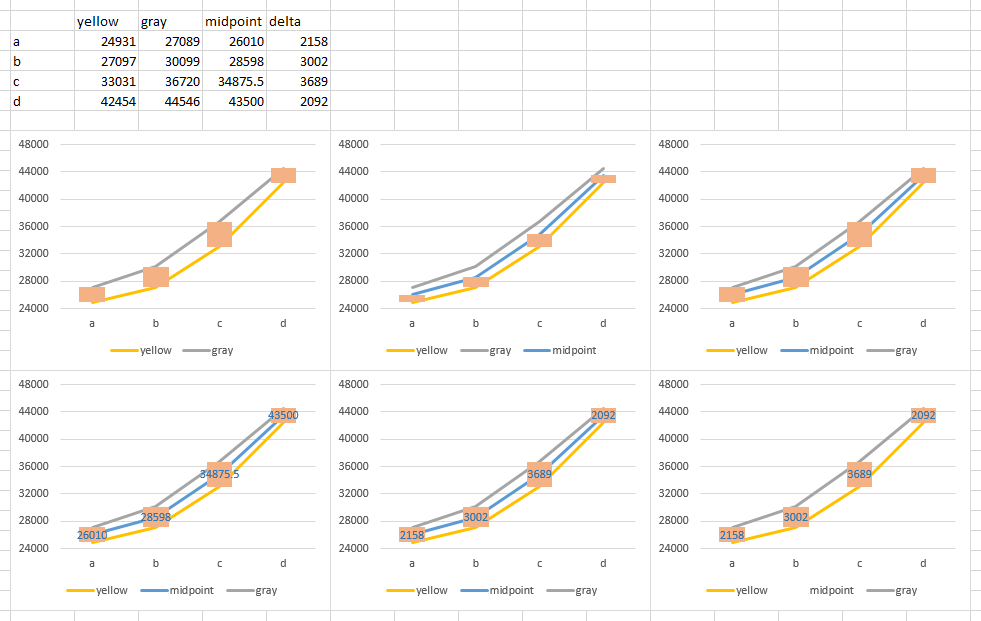
Here's the data. Yellow and gray are the original data, midpoint is the average of yellow and gray, and delta is the difference between yellow and gray.
The top left chart is the original with up-down bars.
I've added the midpoint data to the top middle chart. It messes up the up-down bars, since it's now the last line series, so I've made midpoint the second series in the top right chart. I did this by editing the series formula, and changing the last argument from 3 to 2. You can also use the Select Data dialog to adjust the order of series in the chart (move up/move down). If you start with the data in yellow-midpoint-gray order in the worksheet then make the chart, the series will be in the right order to begin with.
I've added data labels to the midpoint series in the bottom left chart, using the center label position.
In the bottom middle chart, I've used the Values from Cells option for the data labels, and selected the delta column in the worksheet. This only works in Excel 2013, but you use any of the suggestions from my tutorial
Apply Custom Data Labels to Charted Points, including manually overtyping the values you want for each label, or using Rob Bovey's free Chart Labeler addin (from
Application Professionals).
Finally I've formatted the midpoint series so it uses no line in the bottom right chart, so it is hidden.