Days between in- and outgoing for a total average.

Audorin

New Member
Joined
Nov 28, 2021
Messages
8
Office Version
  1. 365
  2. 2021
Platform
  1. Windows
Hello everyone,

I`ve been going absolutely mad with an issue I just can't seem to get my head around.
I'll try to give an example to best detail the issue on hand: Imagine I get a penalty fee by having a too fast of a turnover of the cattle I trade, so If I re-sell the first day it's 17% fee and if I sell after 113 days it's as low as 7% fee.

Bilde_2021-11-28_213900.png

(Example just given for context)

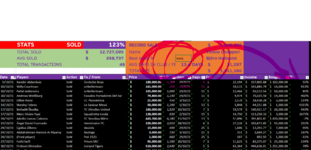
I've sorted all the transactions by date, name if it's sold or bought, price.
Bilde_2021-11-28_214651.png
Bilde_2021-11-28_214559.png


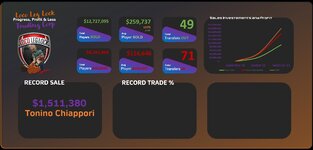
So all I want is the average amount of days between each transaction when the the cattle was bought, to the date the cattle was sold. Instead of calling them cattle, cattle1, and so on..I've given them personal names. (Tore Vagle, Rafal etc.) So I'm trying to get a formula to use the name as a criteria, this since the name can jump around on the list due to having sorting functions (sorting by date, name, value and so on). The only transactions I'm out after are the ones that have been bought and sold, not just bought. So how can I go about using the personal name as a criteria, taking the IN date, then the OUT date (on two seperate sheets) and calculating the number of days the cattle have been in my ownership.

The average days ownership per (all) cattle will help me calculate the fee on all the transactions in a very simple matter. It's just that the formula it self seems a bit hard to make now when my brain has completely shut down on the issue.

Hopeing for a helping hand here, at least to lead me in the right direction!

Thank you!

Per Å
 
you are welcome

it should work with different sheets , but needs the $ as i posted on both ranges
Hey again. Sorry to bother you etaf. I've now pretty much finished off the dashboard to the excel sheet now. I've learned a lot the last few days, but it's still something I'm struggling with since we are doing the index searches now.
How should I go about finding the the best trade %-based. So I need the formula to search the sold list again, and find the the trade that gave me the most profit percentage-wise. Do you have any suggestion for this based on what I linked here earlier?

LLL.xlsm
ABCDEFGHIJKLMNOPQRSTUVWXY
1STATSSOLD123%RECORD SALE$ 1,940,000STATSBUY
2TOTAL SOLD$ 12,727,095Name Tonino Chiappori TOTAL BOUGHT$ 8,281,869
3AVG SOLD$ 259,737TOTAL FEE$ 1,511,380AVG BOUGHT$ 116,646
4TOTAL TRANSACTIONS49AVG DAYS IN CLUB / FEE13.4DAYS$ 31,297TOTAL TRANSACTIONS71
5DateWeek / SeasonPlayersActionTo / FromImportedPriceTSI then®PriceTSIDaysDays ownedFeeIncomeDateColumn1PlayersActionTo/FromImportedPriceTSI then®PriceTSI
65/10/21 (7/79)Xander AbbenhuisSoldGrolsche Boys1 800 000 Kroner1 760(R)$ 180,000.001,76029/9/216$ 22,194$ 157,805.8829/9/21 (6/79)Xander AbbenhuisBoughtZanarkand Duggles1 020 000 Kroner1 710(R)1020001,710
710/10/21 (7/79)Willy CourtmanSoldschleiferteam1 610 000 Kroner(R)$ 161,000.0075029/9/2111$ 19,115$ 141,884.7929/9/21 (6/79)Rafał JaśkiewiczBoughtGKS Najmansi500 000 Kroner1 290(R)500001,290
810/10/21 (7/79)Rafał JaśkiewiczSoldschleiferteam1 050 000 Kroner1 090(R)$ 105,000.001,09029/9/2111$ 12,466$ 92,533.5629/9/21 (6/79)Andreas WeißburgBoughtTC Shanghai140 000 Kroner1 390(R)140001,390
910/10/21 (7/79)Andreas WeißburgSoldEscudos Portadores Del Sur798 000 Kroner1 230(R)$ 79,800.001,23029/9/2111$ 9,474$ 70,325.5029/9/21 (6/79)Willy CourtmanBoughtThe Rampaging Raccoons140 000 Kroner(R)14000780
1010/10/21 (7/79)Dillan RossiSoldFC Plusvalenza210 000 Kroner(R)$ 21,000.004503/10/217$ 2,570$ 18,430.2829/9/21 (6/79)Hugo PalmaBoughtF.C.-Nox99 999 Kroner1 500(R)9999.91,500
1114/10/21 (8/79)Wesley FebresSoldLe Saviour Messi500 000 Kroner1 290(R)$ 50,000.001,2901/10/2113$ 5,848$ 44,151.8829/9/21 (6/79)Egidius ZilkensBoughtLampegat United70 000 Kroner(R)7000520
1217/10/21 (8/79)Beňadik ŠkodkaSoldFC Vitrolles United1 600 000 Kroner1 820(R)$ 160,000.001,82010/10/217$ 19,579$ 140,421.1729/9/21 (6/79)(Fired player)BoughtPalokka City10 000 Kroner(R)1000650
1317/10/21 (8/79)Marc-Vivien YapiSoldSquadretta tonda1 280 000 Kroner(R)$ 128,000.008302/10/2115$ 14,750$ 113,250.3329/9/21 (6/79)Antônio Souza CunhaBoughtSynbios Force10 000 Kroner(R)1000670
1424/10/21 (9/79)Adolfo Lamas CabreraSoldFC Berolina Mitte4 437 000 Kroner6 280(R)$ 443,700.006,28011/10/2113$ 51,896$ 391,803.8130/9/21 (6/79)Gerben BruneelBoughtCadbury Flake FC30 000 Kroner(R)3000940
1524/10/21 (9/79)Ángel David FourcadeSoldHerminator FC2 200 000 Kroner2 010(R)$ 220,000.002,01018/10/216$ 27,126$ 192,873.851/10/21 (6/79)Lasse SejersbølBoughtNongkhai Farmers FC10 000 Kroner(R)1000720
1624/10/21 (9/79)Egidius ZilkensSolddaviola150 000 Kroner(R)$ 15,000.0069029/9/2125$ 1,606$ 13,393.771/10/21 (6/79)Wesley FebresBoughtPigi AF10 000 Kroner1 200(R)10001,200
1724/10/21 (9/79)Abdulrahman Haroon Al-RiyamySoldBazinga30 000 Kroner(R)$ 3,000.005503/10/2121$ 331$ 2,669.271/10/21 (6/79)Øivind KletteBoughtBrave Bandidos10 000 Kroner(R)1000760
1824/10/21 (9/79)(Fired player)SoldPoli 192110 000 Kroner(R)$ 1,000.0066029/9/2125$ 107$ 892.922/10/21 (6/79)Marc-Vivien YapiBoughtLes Eléphants Des Montagnes30 000 Kroner(R)3000840
1927/10/21 (10/79)Fathi SaifiSoldPrison SRC950 000 Kroner1 500(R)$ 95,000.001,50020/10/217$ 11,625$ 83,375.073/10/21 (6/79)Dillan RossiBoughtPressing Forward FC30 000 Kroner(R)3000620
2030/10/21 (10/79)Firdovsi ƏhmədovSoldIceland Tigers5 100 000 Kroner2 640(R)$ 510,000.002,64025/10/215$ 63,364$ 446,636.013/10/21 (6/79)Abdulrahman Haroon Al-RiyamyBoughtGreen Fury10 000 Kroner(R)1000560
Sold Bought
Cell Formulas
RangeFormula
E1E1=SUM(E3/T3)-1
E2E2=SUM(I6:I10003)
E3E3=AVERAGE(I6:I10003)
E4E4=COUNTA(C6:C10003)
K4K4=AVERAGE(DatasebaseSOLD[Days owned])
M1M1=MAX(DatasebaseSOLD[Price])
M2M2=INDEX(DatasebaseSOLD[Players],MATCH(MAX(DatasebaseSOLD[Price]),DatasebaseSOLD[Price],0))
M3M3=SUM(M7:M55)
M4M4=AVERAGE(DatasebaseSOLD[Fee])
T2T2=SUM(X$6:$X9999)
T3T3=AVERAGE(X6:$X$9999)
T4T4=COUNTA(T6:T10003)
I6:I20,X6:X20I6=VALUE(TEXTJOIN("",TRUE,IFERROR(MID(F6,SEQUENCE(20),1)+0,"")))/10
J6:J20,Y6:Y20J6=VALUE(TEXTJOIN("",TRUE,IFERROR(MID(G6,SEQUENCE(20),1)+0,"")))
K6:K20K6=IFNA(INDEX($P$6:$P$76,MATCH(C6,$R$6:$R$76,0)),"")
L6:L20L6=IFERROR([@Date]-[@Days],"")
M6:M20M6= (0.03*[@Price])+((9.91*0.99^[@[Days owned]])/100)*[@Price]
N6:N20N6=[@Price]-[@Fee]
 

Attachments

  • Dashboard.jpg
    Dashboard.jpg
    185.3 KB · Views: 6
Upvote 0

Excel Facts

How can you turn a range sideways?
Copy the range. Select a blank cell. Right-click, Paste Special, then choose Transpose.
setup a column with the profit & percent and any criteria you want to add , maybe time held , inflation etc
for example something thats held for 10years has that money losing money based on inflation etc
then once you have the the "real" profit, you can just use a MAXIFS () or max with a lookup to find the name

you can bring the price bought for over using the same index/match - but instead of date bought, bring over the TOTAL Amount bought for

now you have the price , you can subtract the price sold from the price purchased - less any fees and get a margin.
Now you can work out the % - depends on if you incluse the fees or not or any loss due to time owned

then a MAX() with an index
=Index( Name, match( Max(column of profits) , Column of profits, 0))
simplified example as posted earlier with the extra columns added

Book3
ABCDEFGHIJKLM
1
2profit nameHarry
3Bought SheetSold Sheet
4dateCattle Namecolumn 1pricedateCattle Namecolumn 1priceDate BoughtDays OwnedPrice purchasedprofit
51/1/21fredBought1.510/1/21fredsold2001/1/212731.5198.5
610/1/21HarryBought2.7511/1/21Harrysold30010/1/21312.75297.25
7
Sheet3
Cell Formulas
RangeFormula
M2M2=INDEX(G5:G6,MATCH(MAX(M5:M6),M5:M6,0))
J5:J6J5=INDEX($A$5:$A$6,MATCH(G5,$B$5:$B$6,0))
K5:K6K5=F5-J5
L5:L6L5=INDEX($D$5:$D$6,MATCH(G5,$B$5:$B$6,0))
M5:M6M5=I5-L5
 
Upvote 0
Very nice, thank you again for making sense of it all for me and using your spare time helping hopeless persons like my self.
I have the name displayed now, what if I also want the number, lets say 4500% extracted out of the sheet with the name that was the most profitable in terms of percentages?
 

Attachments

  • Bilde_2021-11-30_001214.png
    Bilde_2021-11-30_001214.png
    117.8 KB · Views: 7
Upvote 0
just use the max() you used in the lookup
MAX(M5:M6)

only issue will be identical values, as index/match only returns 1
starts to get complicated to return multiple values,
 
Upvote 0
Thank you very much. That's it. I'm all done thanks to you. Very very grateful!
 
Upvote 0

Forum statistics

Threads
1,214,591
Messages
6,120,427
Members
448,961
Latest member
nzskater

We've detected that you are using an adblocker.

We have a great community of people providing Excel help here, but the hosting costs are enormous. You can help keep this site running by allowing ads on MrExcel.com.
Allow Ads at MrExcel

Which adblocker are you using?

Disable AdBlock

Follow these easy steps to disable AdBlock

1)Click on the icon in the browser’s toolbar.
2)Click on the icon in the browser’s toolbar.
2)Click on the "Pause on this site" option.
Go back

Disable AdBlock Plus

Follow these easy steps to disable AdBlock Plus

1)Click on the icon in the browser’s toolbar.
2)Click on the toggle to disable it for "mrexcel.com".
Go back

Disable uBlock Origin

Follow these easy steps to disable uBlock Origin

1)Click on the icon in the browser’s toolbar.
2)Click on the "Power" button.
3)Click on the "Refresh" button.
Go back

Disable uBlock

Follow these easy steps to disable uBlock

1)Click on the icon in the browser’s toolbar.
2)Click on the "Power" button.
3)Click on the "Refresh" button.
Go back
Back
Top