Display graph/chart in userform based on Combobox selections

JackDomino1

New Member
Joined
Apr 7, 2020
Messages
39
Office Version
  1. 365
Platform
  1. Windows
Hi all,

So, I have a serform (U1), which has two combo boxes (CB1 and CB2).

I would like the user to be able to make a selection from each combo box and this to plot a graph. The Y-axis values of both comboboxes is the same.

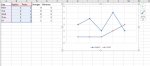
I have a work sheet (see pic), with the number of fruit sales on different days of the week. The purpose of this graph is to be able to compare between two different fruits (hence the 2 combo-boxes).

I am not sure if its possible to embed a graph into a userform? If its not, I guess you could plot the graph based on the selections, save the graph as a picture and display this? but this is well beyond my capabilities.


Thanks
 

Attachments

  • Capture.JPG
    Capture.JPG
    54.6 KB · Views: 37

Excel Facts

Using Function Arguments with nested formulas
If writing INDEX in Func. Arguments, type MATCH(. Use the mouse to click inside MATCH in the formula bar. Dialog switches to MATCH.
Thanks,

I have worked through this article and have managed to get it working, but only for one combobox.
For some reason, I cannot get this the plot two sets of data based on selections from 2 comboboxes.

Every time I try to introduce a second combobox, it overwrites the data of the first.
 
Upvote 0
Can only suggest that you publish all your code here (or better still, place copy of your workbook in a dropbox) & maybe I or others here will be able to help resolve your issue.

Dave
 
Upvote 0
Dim MyChart As Chart
Dim ChartData As Range
Dim chartIndex As Integer
Dim chartindex2 As Integer
Dim ChartName As String

If ComboBox1.Value = "" Then
Exit Sub
End If

chartIndex = ComboBox1.ListIndex
chartindex2 = ComboBox2.ListIndex

Select Case chartIndex


Case 0

Set ChartData = ActiveSheet.Range("B2:B20")
ChartName = ActiveSheet.Range("B1")

Case 1

Set ChartData = ActiveSheet.Range("C2:C20")
ChartName = ActiveSheet.Range("C1")

Case 2

Set ChartData = ActiveSheet.Range("D2:D20")
ChartName = ActiveSheet.Range("D1")

End Select

Select Case chartindex2


Case 0

Set ChartData = ActiveSheet.Range("B2:B20")
ChartName = ActiveSheet.Range("B1")

Case 1

Set ChartData = ActiveSheet.Range("C2:C20")
ChartName = ActiveSheet.Range("C1")

Case 2

Set ChartData = ActiveSheet.Range("D2:D20")
ChartName = ActiveSheet.Range("D1")

End Select

'Application.ScreenUpdating = False

Set MyChart = ActiveSheet.Shapes.AddChart(xlXYScatterLines).Chart

MyChart.SeriesCollection.NewSeries
MyChart.SeriesCollection(1).Name = ChartName
MyChart.SeriesCollection(1).Values = ChartData
MyChart.SeriesCollection(1).XValues = ActiveSheet.Range("A2:A20")
 
Upvote 0
I have made a vain attempt to update your code to do what I think you want but Its been many many years since I have done anything in VBA in connection with charts & may not be fully correct.

Place codes in your userform & see if will do what you want


VBA Code:
Private Sub CommandButton1_Click()
    Dim MyChart     As Chart
    Dim ChartData(1 To 2) As Range
    Dim ChartIndex(1 To 2) As Integer
    Dim ChartName(1 To 2) As String, imageName As String
    Dim lr As Long
    Dim ws As Worksheet
    
                          
    Set ws = ActiveSheet
    
    ChartIndex(1) = Me.ComboBox1.ListIndex
    ChartIndex(2) = Me.ComboBox2.ListIndex
    
    lr = ws.UsedRange.Rows.Count - 1
    
    If ChartIndex(1) = -1 Then Exit Sub
    
'1st series range
    Set ChartData(1) = ws.Cells(2, 2 + ChartIndex(1)).Resize(lr)
    ChartName(1) = ws.Cells(1, 2 + ChartIndex(1))
'2nd series range
    Set ChartData(2) = ws.Cells(2, 2 + ChartIndex(2)).Resize(lr)
    ChartName(2) = ws.Cells(1, 2 + ChartIndex(2))
    
'chart style
    Set MyChart = ws.Shapes.AddChart(xlXYScatterLines).Chart
    
    With MyChart
'1st Series
        .SeriesCollection.NewSeries
        With .SeriesCollection(1)
            .Name = ChartName(1)
            .Values = ChartData(1)
            .XValues = ws.Cells(2, 1).Resize(lr)
        End With
'2nd series
        If ChartIndex(2) <> -1 Then
            .SeriesCollection.NewSeries
            With .SeriesCollection(2)
                .Name = ChartName(2)
                .Values = ChartData(2)
                .XValues = ws.Cells(2, 1).Resize(lr)
            End With
        End If
'specify the position of the legend
        .SetElement msoElementLegendBottom
    End With
    
'display in userform
    imageName = Application.DefaultFilePath & Application.PathSeparator & "TempChart.gif"
    MyChart.Export Filename:=imageName
    ws.ChartObjects(1).Delete
    Application.ScreenUpdating = True
    With Me.Image1
        .AutoSize = True
        .Picture = LoadPicture(imageName)
'adjust form size to image
    Me.Height = .Top + .Height + 50
    End With
    
End Sub

Private Sub UserForm_Initialize()
    Dim arr As Variant
'populates combobox with avaliable fruits
    arr = Array("Apples", "Pears", "Oranges", "Bananas")
    Me.ComboBox1.List = arr
    Me.ComboBox2.List = arr
    
End Sub

Hopefully, this will go in right direction but you will need to develop further to meet specific project need - if not, it will need someone with an up to date understanding of charts created from VBA to step in and assist.

Dave
 
Upvote 0
Works perfectly. Very clearly structured, so I think adapting to suit project needs will be simple enough.

Thank you very much for your help this afternoon!
 
Upvote 0
Works perfectly. Very clearly structured, so I think adapting to suit project needs will be simple enough.

Thank you very much for your help this afternoon!

I surprise myself sometimes - Glad update helps you

Many thanks for feedback

Dave
 
Upvote 0

Forum statistics

Threads
1,214,826
Messages
6,121,793
Members
449,048
Latest member
greyangel23

We've detected that you are using an adblocker.

We have a great community of people providing Excel help here, but the hosting costs are enormous. You can help keep this site running by allowing ads on MrExcel.com.
Allow Ads at MrExcel

Which adblocker are you using?

Disable AdBlock

Follow these easy steps to disable AdBlock

1)Click on the icon in the browser’s toolbar.
2)Click on the icon in the browser’s toolbar.
2)Click on the "Pause on this site" option.
Go back

Disable AdBlock Plus

Follow these easy steps to disable AdBlock Plus

1)Click on the icon in the browser’s toolbar.
2)Click on the toggle to disable it for "mrexcel.com".
Go back

Disable uBlock Origin

Follow these easy steps to disable uBlock Origin

1)Click on the icon in the browser’s toolbar.
2)Click on the "Power" button.
3)Click on the "Refresh" button.
Go back

Disable uBlock

Follow these easy steps to disable uBlock

1)Click on the icon in the browser’s toolbar.
2)Click on the "Power" button.
3)Click on the "Refresh" button.
Go back
Back
Top