Display Value of Intersecting Lines on Chart

JaseTheCurious

New Member
Joined
May 11, 2017
Messages
7
Hello all

A simple, possibly naive question that I hope someone has a quick answer to....

I have a line chart with just two lines, is there an easy way of displaying the X axis value of the point at which these lines intersect?

Many searches have returned results for the INTERSECT function which isn't quite what I'm after.

thanks!
 

Excel Facts

Waterfall charts in Excel?
Office 365 customers have access to Waterfall charts since late 2016. They were added to Excel 2019.
I think you need to add another chart range. Create a column that has a formula that reports the following, assuming you have DataA and DataB being the two lines: if the cell in DataA = the cell in DataB, report either number, else report NA. Add that new range to the chart.
 
Upvote 0
Thank you for taking the time to respond.

The issue I have with the above solution is that I don't have a recorded scenario where DataA = DataB, instead I have recorded points where DataA < Data B, and where point where DataA > DataB.
My quest is to accurately find the value where DataA = DataB.

I hope that makes sense?
 
Upvote 0
Thus, the first problem is to calculate the crossing points.
A simple option is using a custom function, for example this code:
Code:
Function Crossing(ByRef aSerie As Range, bSerie As Range, xSerie As Range) As Double
'Vedi https://www.mrexcel.com/board/threads/display-value-of-intersecting-lines-on-chart.1218682/
Dim M1 As Boolean, M2 As Boolean, dA As Double, dB As Double, dX As Double
Dim I As Long
'
For I = 1 To aSerie.Rows.Count - 1
    M1 = aSerie.Cells(I, 1).Value > bSerie.Cells(I, 1).Value
    M2 = aSerie.Cells(I + 1, 1).Value > bSerie.Cells(I + 1, 1).Value
    If M1 <> M2 Then Exit For
Next I
If aSerie.Cells(I + 1, 1).Value = bSerie.Cells(I + 1, 1).Value Then
    Crossing = xSerie.Cells(I + 1, 1)
ElseIf aSerie.Cells(I, 1).Value = bSerie.Cells(I, 1).Value Then
    Crossing = I
Else
    dA = Abs(aSerie.Cells(I, 1) - bSerie.Cells(I, 1))
    dB = Abs(aSerie.Cells(I + 1, 1) - bSerie.Cells(I + 1, 1))
    dX = xSerie.Cells(I + 1, 1) - xSerie.Cells(I, 1)
    Crossing = dX / (dB / dA + 1) + xSerie.Cells(I, 1)
End If
End Function
Copy this code into a standard vba module of your vba project; then you will be able to use the function Crossing using the following syntax:
Code:
CROSSING(Range_for_Serie1, Range_for_Serie2, Range_for_xAxis)

This searches at wich step the two series crosses and calculate a linear interpolation using the "before crossing" and "after crossing" coordinates
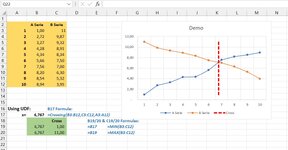
With the data shown in the image, I used in B17 this formula:
Excel Formula:
=Crossing(B3:B12,C3:C12,A3:A12)

Another suitable option would have been asking Excel to draw a "tendency line" for the two series, searching for the ones that best represent the series; then using their formulas to search for the expected crossing point. But this option would have been neither more precise nor simpler to develop...


At this point, if you wish to draw a bar on the graph you might go for a "combined graph":
-first, create a new serie with the coordinates of the bar
-then add this new serie to the graph and go for a "combined graph"
-select, for the new serie, the "scattered with lines" option (I am not sure about the name in English of this option) and make sure this third serie uses the same X-axis of the main series.
My demo is shown in the image:
-the main series are in the golden area
-the crossing X is calculated in B17 using the CROSSING function
-the additional serie is created in the green area: x is the crossing value, y is the Max and Min of the main series
The formulas used are shown in Blue in the image

Try...
 

Attachments

  • INTERSECTION-a_Immagine 2022-10-09 130303.jpg
    INTERSECTION-a_Immagine 2022-10-09 130303.jpg
    117.1 KB · Views: 16
Upvote 0
Thank you for taking the time to respond.

The issue I have with the above solution is that I don't have a recorded scenario where DataA = DataB, instead I have recorded points where DataA < Data B, and where point where DataA > DataB.
My quest is to accurately find the value where DataA = DataB.

I hope that makes sense?
Right. Of course. I will see if I can create a non-VBA way to do this.
 
Upvote 0
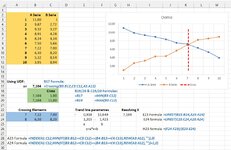
A possible Non-Vba solution; reference to the attached image:
-In A23 we identify the step just before the crossing and (in B23 and C23) its x and y values
-In A24 we identify the step just after the crossing and its x & y value
-In E-F23 we calculate the parametres for the linear trend line of the 2-elements A-Serie identified as above, using function LINEST
-In E-F24 we do the same for B-Serie
These are a and b for the equation y=a*x+b that describe each of the serie
-In H23 we calculate the x where Ay and By are equal, ie the crossing X
Now we may recreate the crossing point to draw on the chart, as we did in B19:C20 for the vba approach

The formulas used are in the image, but let me add the minisheet for the range A21:M31
MULTI_C21008.xlsm
ABCDEFGHIJKLM
21
22Crossing ElementsTrend line parametresResolving X
237 7,22 7,00 - 0,918 13,649 7,104 E23 Formula=LINEST(B23:B24,A23:A24)
248 6,30 8,20 1,203 - 1,423 E24 formula=LINEST(C23:C24,A23:A24)
25ab
26y=a*x+bH23 formula=(F24-F23)/(E23-E24)
27
28A23 Formula=INDEX(A1:C12,MIN(IF((B3:B12>=C3:C12)<>(B4:B13>=C4:C13),ROW(A3:A12),"")),0)
29A24 Formula=INDEX(A1:C12,MIN(IF((B3:B12>=C3:C12)<>(B4:B13>=C4:C13),ROW(A3:A12),""))+1,0)
30
31
Foglio2 (2)
Cell Formulas
RangeFormula
H23H23=(F24-F23)/(E23-E24)
A23:C23A23=INDEX(A1:C12,MIN(IF((B3:B12>=C3:C12)<>(B4:B13>=C4:C13),ROW(A3:A12),"")),0)
A24:C24A24=INDEX(A1:C12,MIN(IF((B3:B12>=C3:C12)<>(B4:B13>=C4:C13),ROW(A3:A12),""))+1,0)
E23:F23E23=LINEST(B23:B24,A23:A24)
E24:F24E24=LINEST(C23:C24,A23:A24)
Dynamic array formulas.


If your Excel version doesn't support Dynamic Array then most of the formulas are to be confirmed using the combination Contr-Shift-Enter, nor Enter alone
If your Excel support Dynamic Array, then the formulas could be improved to simplify their readability and adaptibility
 

Attachments

  • INTERSECTION-b_Immagine 2022-10-09 130303.jpg
    INTERSECTION-b_Immagine 2022-10-09 130303.jpg
    161 KB · Views: 9
Last edited:
Upvote 0

Forum statistics

Threads
1,214,950
Messages
6,122,438
Members
449,083
Latest member
Ava19

We've detected that you are using an adblocker.

We have a great community of people providing Excel help here, but the hosting costs are enormous. You can help keep this site running by allowing ads on MrExcel.com.
Allow Ads at MrExcel

Which adblocker are you using?

Disable AdBlock

Follow these easy steps to disable AdBlock

1)Click on the icon in the browser’s toolbar.
2)Click on the icon in the browser’s toolbar.
2)Click on the "Pause on this site" option.
Go back

Disable AdBlock Plus

Follow these easy steps to disable AdBlock Plus

1)Click on the icon in the browser’s toolbar.
2)Click on the toggle to disable it for "mrexcel.com".
Go back

Disable uBlock Origin

Follow these easy steps to disable uBlock Origin

1)Click on the icon in the browser’s toolbar.
2)Click on the "Power" button.
3)Click on the "Refresh" button.
Go back

Disable uBlock

Follow these easy steps to disable uBlock

1)Click on the icon in the browser’s toolbar.
2)Click on the "Power" button.
3)Click on the "Refresh" button.
Go back
Back
Top