Thus, the first problem is to calculate the crossing points.
A simple option is using a custom function, for example this code:
Code:
Function Crossing(ByRef aSerie As Range, bSerie As Range, xSerie As Range) As Double
'Vedi https://www.mrexcel.com/board/threads/display-value-of-intersecting-lines-on-chart.1218682/
Dim M1 As Boolean, M2 As Boolean, dA As Double, dB As Double, dX As Double
Dim I As Long
'
For I = 1 To aSerie.Rows.Count - 1
    M1 = aSerie.Cells(I, 1).Value > bSerie.Cells(I, 1).Value
    M2 = aSerie.Cells(I + 1, 1).Value > bSerie.Cells(I + 1, 1).Value
    If M1 <> M2 Then Exit For
Next I
If aSerie.Cells(I + 1, 1).Value = bSerie.Cells(I + 1, 1).Value Then
    Crossing = xSerie.Cells(I + 1, 1)
ElseIf aSerie.Cells(I, 1).Value = bSerie.Cells(I, 1).Value Then
    Crossing = I
Else
    dA = Abs(aSerie.Cells(I, 1) - bSerie.Cells(I, 1))
    dB = Abs(aSerie.Cells(I + 1, 1) - bSerie.Cells(I + 1, 1))
    dX = xSerie.Cells(I + 1, 1) - xSerie.Cells(I, 1)
    Crossing = dX / (dB / dA + 1) + xSerie.Cells(I, 1)
End If
End Function
Copy this code into a standard vba module of your vba project; then you will be able to use the function Crossing using the following syntax:
Code:
CROSSING(Range_for_Serie1, Range_for_Serie2, Range_for_xAxis)
This searches at wich step the two series crosses and calculate a linear interpolation using the "before crossing" and "after crossing" coordinates
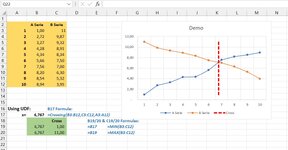
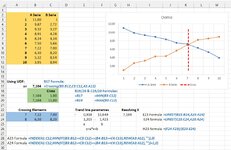
With the data shown in the image, I used in B17 this formula:
Excel Formula:
=Crossing(B3:B12,C3:C12,A3:A12)
Another suitable option would have been asking Excel to draw a "tendency line" for the two series, searching for the ones that best represent the series; then using their formulas to search for the expected crossing point. But this option would have been neither more precise nor simpler to develop...
At this point, if you wish to draw a bar on the graph you might go for a "combined graph":
-first, create a new serie with the coordinates of the bar
-then add this new serie to the graph and go for a "combined graph"
-select, for the new serie, the "scattered with lines" option (I am not sure about the name in English of this option) and make sure this third serie uses the same X-axis of the main series.
My demo is shown in the image:
-the main series are in the golden area
-the crossing X is calculated in B17 using the CROSSING function
-the additional serie is created in the green area: x is the crossing value, y is the Max and Min of the main series
The formulas used are shown in Blue in the image
Try...