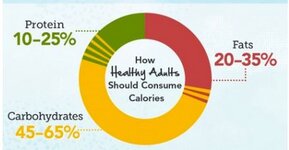
Donut Chart with Variable Range of Data

FAH

New Member
Joined
Feb 27, 2021
Messages
1
Office Version
  1. 2016
Platform
  1. Windows
I want to create a donut/pie chart but my data has variable ranges of data. Attached is what I want the chart to look like but I cannot figure out how to create this in Excel.

Macronutrients % Daily
Fat 25-60%
Protein 19-35%
Carbs 22-40%
 

Attachments

  • Infographic2.JPG
    Infographic2.JPG
    21.9 KB · Views: 5

Excel Facts

Which Excel functions can ignore hidden rows?
The SUBTOTAL and AGGREGATE functions ignore hidden rows. AGGREGATE can also exclude error cells and more.

Forum statistics

Threads
1,214,631
Messages
6,120,640
Members
448,974
Latest member
DumbFinanceBro

We've detected that you are using an adblocker.

We have a great community of people providing Excel help here, but the hosting costs are enormous. You can help keep this site running by allowing ads on MrExcel.com.
Allow Ads at MrExcel

Which adblocker are you using?

Disable AdBlock

Follow these easy steps to disable AdBlock

1)Click on the icon in the browser’s toolbar.
2)Click on the icon in the browser’s toolbar.
2)Click on the "Pause on this site" option.
Go back

Disable AdBlock Plus

Follow these easy steps to disable AdBlock Plus

1)Click on the icon in the browser’s toolbar.
2)Click on the toggle to disable it for "mrexcel.com".
Go back

Disable uBlock Origin

Follow these easy steps to disable uBlock Origin

1)Click on the icon in the browser’s toolbar.
2)Click on the "Power" button.
3)Click on the "Refresh" button.
Go back

Disable uBlock

Follow these easy steps to disable uBlock

1)Click on the icon in the browser’s toolbar.
2)Click on the "Power" button.
3)Click on the "Refresh" button.
Go back
Back
Top