dinesababu1
New Member
- Joined
- Oct 28, 2016
- Messages
- 13
Hello Everyone,
There is a dashboard I update every month for which I can use some help better automating.
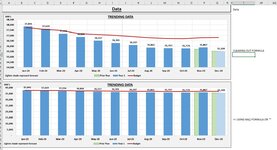
I only need the green column labeled "Prior Year" to appear on certain "forecast" months (hence for the example below the months November and December...and next month I will roll forward to just display in December)
Every month I have been clearing out the formula for this green column so it appears only in the forecast months.
I would like to automate the formula for this column so it is truly blank or nonexistent for all months except the forecast months.
I tried combining IF formulas with NA() formula or "" however this effects the axis my graph. (in the example below I use "IF(AG3="FRCST",AG12,NA())")
It seems that if there are any formulas at all the graph interprets it as data and starts the axis at 0 rather than auto adjusting the axis based on the data.
Is there anyway to solve this issue prefably without using VBA?
..... If there is truly no way to solve it without using VBA than can someone tell me how to use VBA to solve this issue. Thank you everyone.

There is a dashboard I update every month for which I can use some help better automating.
I only need the green column labeled "Prior Year" to appear on certain "forecast" months (hence for the example below the months November and December...and next month I will roll forward to just display in December)
Every month I have been clearing out the formula for this green column so it appears only in the forecast months.
I would like to automate the formula for this column so it is truly blank or nonexistent for all months except the forecast months.
I tried combining IF formulas with NA() formula or "" however this effects the axis my graph. (in the example below I use "IF(AG3="FRCST",AG12,NA())")
It seems that if there are any formulas at all the graph interprets it as data and starts the axis at 0 rather than auto adjusting the axis based on the data.
Is there anyway to solve this issue prefably without using VBA?
..... If there is truly no way to solve it without using VBA than can someone tell me how to use VBA to solve this issue. Thank you everyone.