Eliminating Color filled cells from the formulas

UDFNewbie

New Member
Joined
Mar 1, 2021
Messages
9
Office Version
  1. 365
Platform
  1. Windows
Hello All,

I am new to this forum and UDF's (which is what I think I need for the following) so I appreciate the advice:

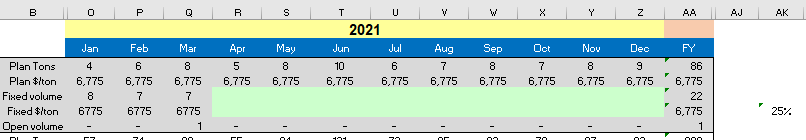
In the below picture, I am doing several things:

1) Tracking my consumption of different materials (rows 3&4) vs. plan (rows 1&2)
2) Calculating my purchased consumption (cell showing 25% to the right)
3) Forecasting Full year spend in the (GREEN). I am entering values and forecasting my total full year spend. ISSUE: When I forecast the rest of year in green, it updated the cell with the 25%

QUESTION:
1) Is there a way to have the cell with the formula for 25% calculated only those cells that are not colored green? (NOTE: The 25% is driven really just by the row titled "fixed volume").
2) This same 5 rows below are repeated many times for other materials. Will the solution for #1 need to be done on each "25%" formula on each tab of the workbook?

Thanks in advance for the communities help!

UDFNewbie

1614636765054.png
 

Excel Facts

Why are there 1,048,576 rows in Excel?
The Excel team increased the size of the grid in 2007. There are 2^20 rows and 2^14 columns for a total of 17 billion cells.
Im not sure you have said how 25% is calculated? Plus we will need to know what the colour is. Green isnt enough for the machine to recognise it.
 
Upvote 0
Im not sure you have said how 25% is calculated? Plus we will need to know what the colour is. Green isnt enough for the machine to recognise it.
Thanks for the quick feedback!

  1. Green: (Red 205; green 255; blue 204; Hex #CCFFCC)
  2. The formula for the 25% is complicated (maybe overly) but it is as follows: =IF(O5=0,0,IF(AVERAGE(O5:Z5)>AVERAGE(O3:Z3),IF(AA5>AA3,1,AA5/(AVERAGE(O5:Z5)*12)),AA5/AA3))
1614639425380.png
 

Attachments

  • 1614639323573.png
    1614639323573.png
    9.9 KB · Views: 5
Upvote 0
Average will ignore those green cells anyway as they are empty.
 
Upvote 0
Average will ignore those green cells anyway as they are empty.

I agree however if you see #3 in my original post, the same row is also used to forecast full year spend and thus at the end of each monthly cycle there are numbers in those green cells to help estimate the full year spend. This will then change the 25% cell (%fixed). Thus, I am trying to know the true % of fixed spend and so I want to eliminate anything colored in green for the % calculation formula.

One additional point of potential complexity: As the year progress, we fix more of our pricing and thus un-highlight the green as the year moves forward.
 
Upvote 0
You could create a function like this and use it in your longer formula. Be a little careful when using formatting in a function. Whilst it works as such it doesnt always trigger excel into recalculating. You will have to experiment.

VBA Code:
Function AVERAGE_NG(average_range As Range, Optional R As Double = 205, Optional G As Double = 255, Optional B As Double = 204) As Variant

Dim lCount As Long, lSum As Long, c As Range

lCount = 0
lSum = 0
    
For Each c In average_range
    If IsNumeric(c) And Len(c) > 0 And c.Interior.Color <> RGB(R, G, B) Then
        lCount = lCount + 1
        lSum = lSum + c.Value
    End If
Next

If lCount = 0 Then
    AVERAGE_NG = CVErr(xlErrDiv0)
Else
    AVERAGE_NG = lSum / lCount
End If

End Function
 
Upvote 0
Thank you! A final few questions I am new to coding:

1) I tried to customized the code for my UDF Module but I am getting an error message or no error message but the code does not work. Am I to substitute my range O5:Z5 for all the spots it says "range"? or Just in the the first line of the code? Also do I need to update RGB colors in the middle of the code or just on top row? Would it be possible to update the code above for my range O5:Z5?

2) Last question: I have many formulas on this tab and other tabs in this workbook. Is this code specific to each cell I am on when I hit ALT+FN11? Or is this code good for the whole tab/whole workbook and it is based on the range used above in the code?

I really appreciate the help as a new coder. Thanks!
 
Upvote 0
You can just use it the same as you would any native function. In your case you can use it to replace AVERAGE with AVERAGE_NG so in your formula you provided this bit:

AVERAGE(O5:Z5)

becomes

AVERAGE_NG(O5:Z5)

It uses the default values of the RGB you gave previously but you could use different if needed eg:

AVERAGE_NG(O5:Z5,255,255,0)
 
Upvote 0
You should be aware that changing a cell's color does not trigger calculation.
If you have this formula set up to ignore green and the user makes a cell green, the formula will not re-calculate and the value seen will not reflect the change in color. (Making the UDF volatile will not fix this.)
Using color as data in Excel is fraught with problems and is contra-indicated.
Thank you for this! That row starts out green O5:Z5 January 1st each year. As I take a position on the material and lock the price, the green goes away for the months that I fix. Are you saying then the above will not work?

for clarity, I am using that row to do two things.....

1) Forecast spend. So the cells not green are actual prices but I am asking my team to forecast what they THINK the open months will be so we can always have a full year latest estimate. This is important.
2) True fixed position: Unfortunately I am trying to use that same row to also calculate what % I truly have fixed. There are many materials we are tracking so I am trying to make something work so that I don't split them separately and make the team do double work.

Any advice would be appreciated.
 
Upvote 0

Forum statistics

Threads
1,214,387
Messages
6,119,208
Members
448,874
Latest member
Lancelots

We've detected that you are using an adblocker.

We have a great community of people providing Excel help here, but the hosting costs are enormous. You can help keep this site running by allowing ads on MrExcel.com.
Allow Ads at MrExcel

Which adblocker are you using?

Disable AdBlock

Follow these easy steps to disable AdBlock

1)Click on the icon in the browser’s toolbar.
2)Click on the icon in the browser’s toolbar.
2)Click on the "Pause on this site" option.
Go back

Disable AdBlock Plus

Follow these easy steps to disable AdBlock Plus

1)Click on the icon in the browser’s toolbar.
2)Click on the toggle to disable it for "mrexcel.com".
Go back

Disable uBlock Origin

Follow these easy steps to disable uBlock Origin

1)Click on the icon in the browser’s toolbar.
2)Click on the "Power" button.
3)Click on the "Refresh" button.
Go back

Disable uBlock

Follow these easy steps to disable uBlock

1)Click on the icon in the browser’s toolbar.
2)Click on the "Power" button.
3)Click on the "Refresh" button.
Go back
Back
Top